SEQUENCE-TO-SEQUENCE-BASED PARSER
by Chase Ting Chong
Overview
Sequence-to-sequence approaches serialize meaning representation graphs using graph linearization techniques. A sequence-to-sequence neural network can then be trained to directly predict the serialization given an input sentence.
Sequence-to-sequence parsers using BART have achieved state-of-the-art results for AMR parsing we therefore investigate the extensibility to EDS parsing and compare the results to previous RNN-based approaches.
Research Questions
We aimed to answer the following research questions during our study:
RQ1. How does the F1 score of the BART model compare to the F1 score of previous RNN based encoder-decoder models?
RQ2. How does the F1 score of a pretrained model compare to that of a non-pretrained model?
Methods
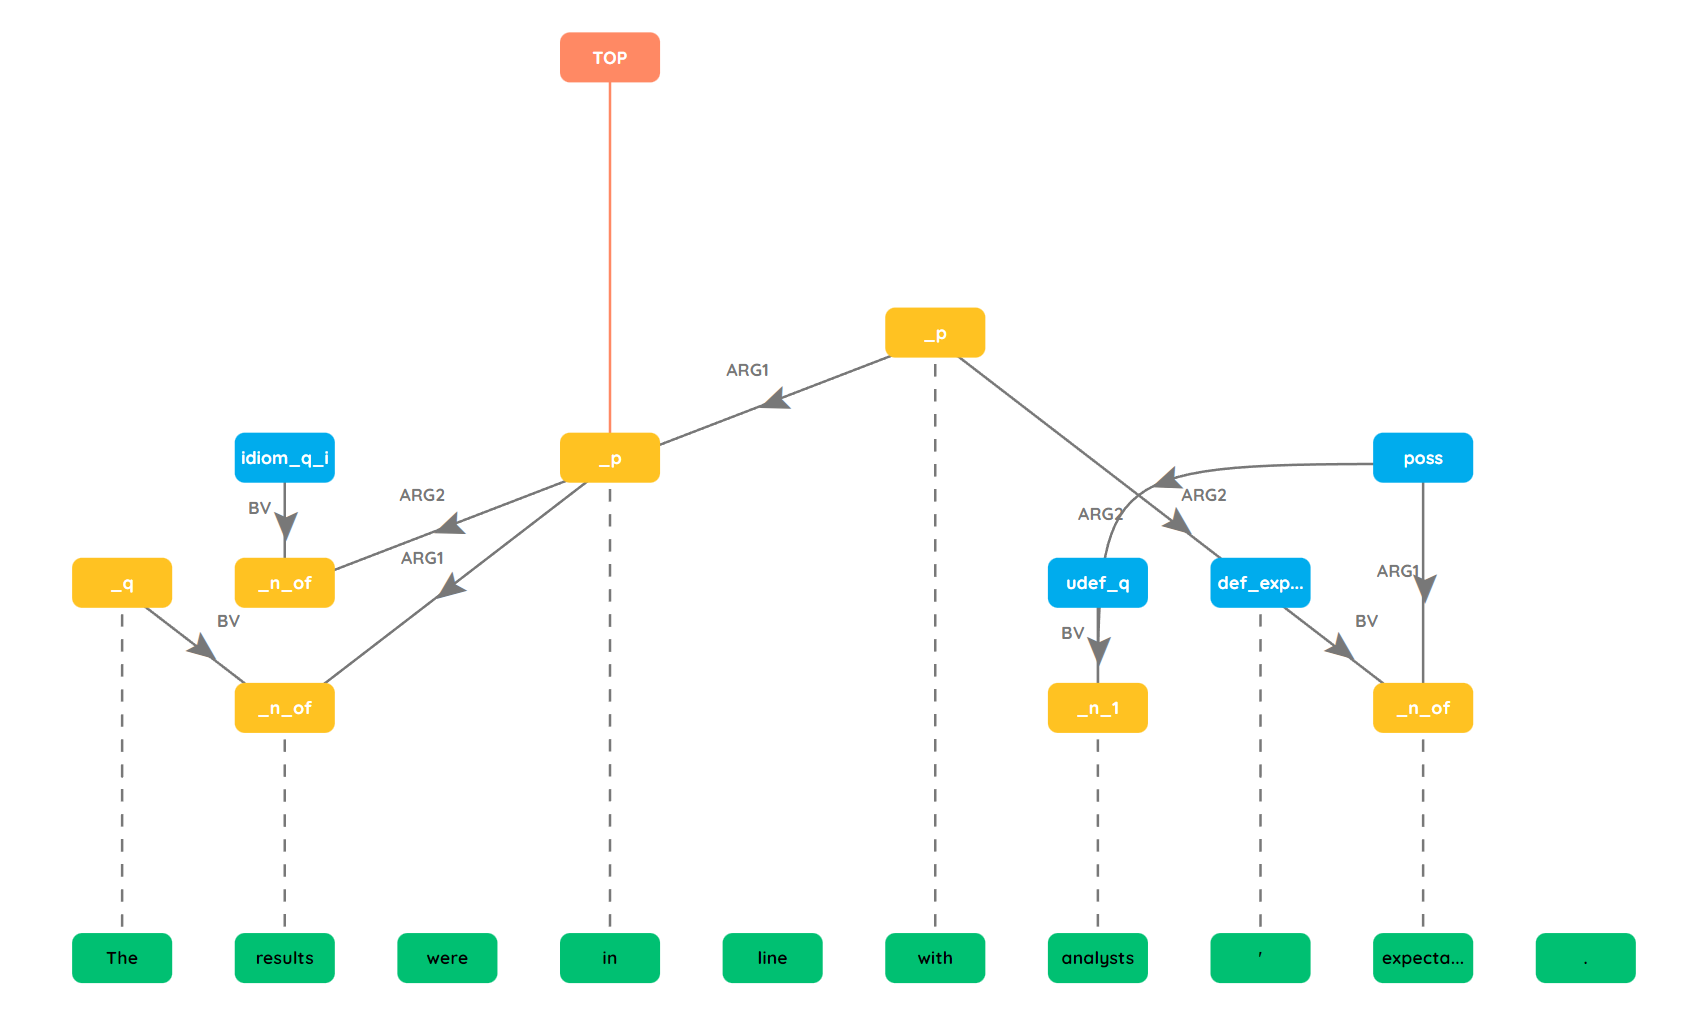
Graph Linearization
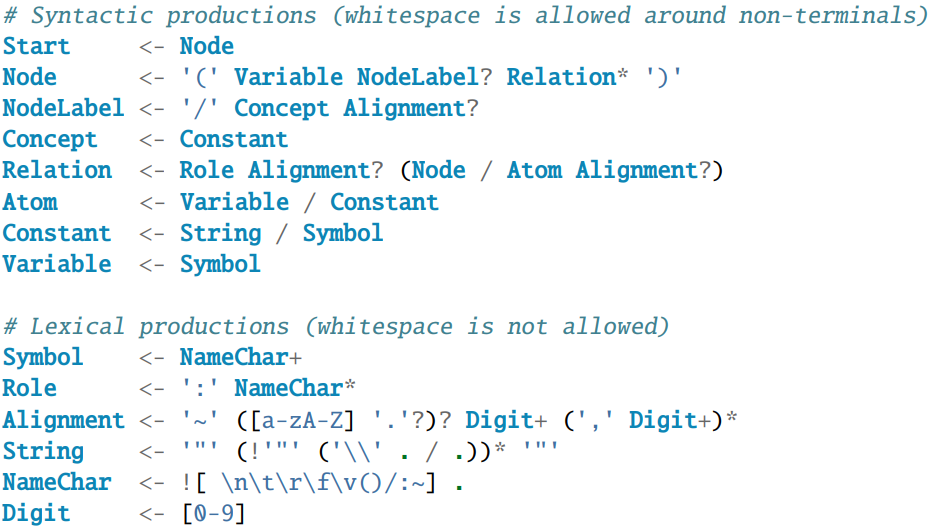
PENMAN is a graph serialization format used to encode the semantic dependencies for directed, rooted graphs. The structure of PENMAN notation can be defined by the Parsing Expression Grammar (PEG) shown above. We modify the node structure of PENMAN to create a simpler linearization. The lemma (root word) is removed from the node label and combined with a token level span which maps the tokens in the input sentence to the node. This combination creates a unique identifier for a node. This simplification is easier for our neural network model to learn as it reduces data sparsity and makes it easier for the model to predict the spans due to the input being tokenized.
BART
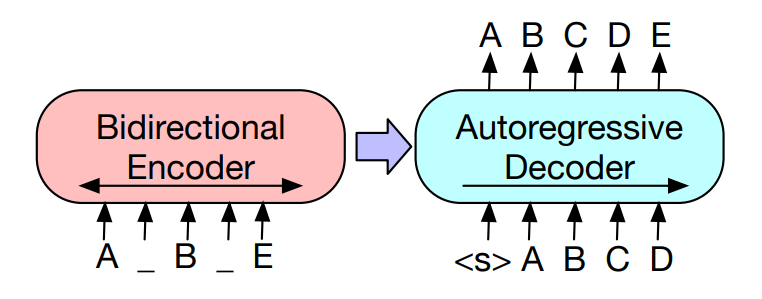
BART is a pre-trained encoder-decoder transformer model. BART uses a BERT-like bidirectional encoder, which uses bidirectional self-attention and a Masked Language Model (MLM) to produce deep contextualized representations that combine left and right context. For decoding BART uses a GPT-like autoregressive decoder, meaning it uses previous predictions to generate output from left-to-right. We fine-tune the BART model to predict linearized graphs given an English sentence. We do this by further training the model on sentence-PENMAN pairs using the sentence as input and the PENMAN linearization as the target output.
Post Processing
To make sure that graphs predicted by the model are valid, it is necessary to perform some postprocessing on the output of our models. We created a LL(1) parser based on the PEG that is used to correct any malformed output that our model may produce.
Model Evaluation
To evaluate our models, we make use of Elementary Dependency Matching (EDM) to calculate the precision, recall and F1 score and the Smatch library to calculate Smatch score. These are common metrics used to evaluate semantic graph structures.
EDM
EDM converts the gold graph and the predicted graph into a series of tuples. Once the two graphs have been converted into tuples, the tuples are matched to get the true positives (TP), false positives (FP) and false negatives (FN) for the nodes and edges respectively which can then be used to calculate the precision, recall and F1 score.
SMATCH
Smatch is an evaluation metric for AMR graphs. The Smatch score is calculated by finding a node mapping that maximizes the number of matching edge triples. The main difference between EDM and Smatch is that Smatch does not consider the alignment between the graph and its surface sentence.
Results and Discussion
A subset of our results is shown below, to view all results please refer to the paper.
| Model | EDM | EDMP | EDMA | Smatch |
|---|---|---|---|---|
| bart-base-tuned | 70.65 | 74.61 | 66.69 | 82.39 |
| pt-bart-base | 91.12 | 93.08 | 89.16 | 91.60 |
| pt-bart-large | 89.73 | 91.69 | 87.78 | 92.59 |
| AE RNN | 85.48 | 88.14 | 82.20 | 86.50 |
| Hitachi | 93.56 | - | - | - |
The results of evaluating three of our five models can be seen above pt- indicates the model is pretrained and bart-base-tuned is the non-pretrained base model that was trained using the hyperparameters found from a hyperparameter search. Additionally, two other systems are shown for comparison; AE RNN which is a Arc Eager Transition-based Sequence-to-Sequence parser that makes use of a RNN, and the Hitachi systems which is the state-of-the-art EDS parser.
The table includes the following metrics:
- EDM - the overall EDM score
- EDMP - EDM score for predicates (nodes)
- EDMA - EDM score for arguments (edges)
- Smatch - the overall Smatch score
The pt-bart-base model achieved the best results for all EDM scores while the pt-bart-large model achieved the highest Smatch score. This is a slightly unexpected result as the larger model should be more accurate in general. We believe this may be due to a slight overfitting in the large model.
The pretrained models greatly outperform their non-pretrained counterparts we believe that the understanding of the English language that is encoded into the pretrained models greatly influences the model’s ability to predict node and edge labels as these labels are closely related to the role an English word plays in the sentence which the pretrained model should have some understanding of.
As seen above both our base and large model outperformed the AE RNN model across all metrics, notably pt-bart-base achieved a 5.64 greater EDM score and pt-bart-large achieved a 6.09 greater Smatch score. When comparing our models to the Hitachi System while both were trained on the same training data the Hitachi System uses a slightly different data set containing data mixed in from other sources for validation and testing. We therefore, cannot directly compare the models. However, given that the test set for the Hitachi System is larger and consists of mixed texts it can be argued that the results of the Hitachi System are more accurate and the model has a better ability to generalize. While the EDM score of the Hitachi System is 2.44 points higher than our current models’ we hypothesize that the BART model has the potential to outperform the Hitachi System this however, requires further research to support this claim.
Conclusions and Future Work
Through our experiments we have shown that our BART-based models outperform the previous RNN-based model improving EDM and Smatch score by 5.64 and 6.09 respectively. Furthermore, our results show that the use of pretraining greatly impacts the performance of our models. Finally, our model achieves a EDM score 2.44 points lower than that of the state-of-the-art Hitachi System, we therefore hypothesize that the BART has the potential to outperform the Hitachi System if further optimized.
We leave the following to future work:
- Further and more in depth hyperparameter tuning.
- Exploring other graph linearization approaches.
 ©
2022 (2019) Design by Participating Students (Template: All Rights Reserved. Design by
©
2022 (2019) Design by Participating Students (Template: All Rights Reserved. Design by