Server
The server is written in C++. It is responsible for the following operations, depending on the remote procedure call made by the client:
- Storage of data cubes/astronomical data files to be visualized.
- Level of detail (LOD) model generation - the server is responsible for downsampling the full data cube to a cube small enough to be rendered in the client's internet browser. The default value is 10 mb but the user can change this at will (see client).
- Rendering the full data cube using offscreen rendering.
- Generating and encoding high resolution images and continually streaming them to the client. The server continually captures screenshots of the offscreen render, encodes them and streams them to the client.

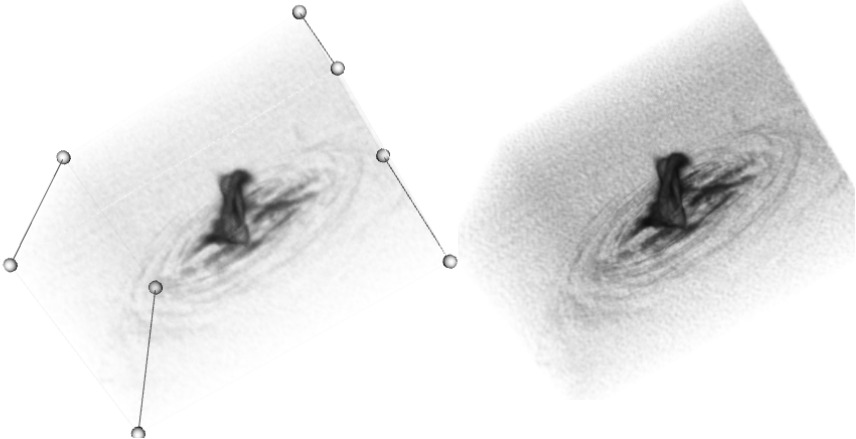
Right: A high resolution screenshot of the full cube being rendered on the server, captured from an offscreen buffer.
Evaluation methods
The evaluation metrics were designed in order to determine the scalability of the final solution. Rather than attempting to make the application as responsive as possible with data sets which are small enough to be stored on our PCs, the goal was to build a server which would be able to handle much larger cubes if it had access to the neccessary computing hardware - large memory storage and powerful GPU(s). Each of the following three tests were conducted on cubes of three different size (42mb, 195mb, 565mb):
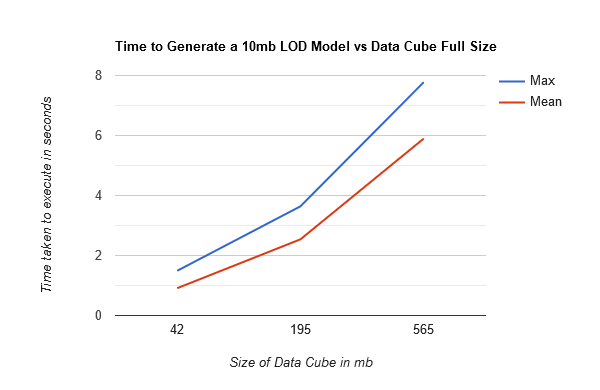
- The time taken to generate a 10mb LOD model. Tests were conducted using both the mean and max sampling method.
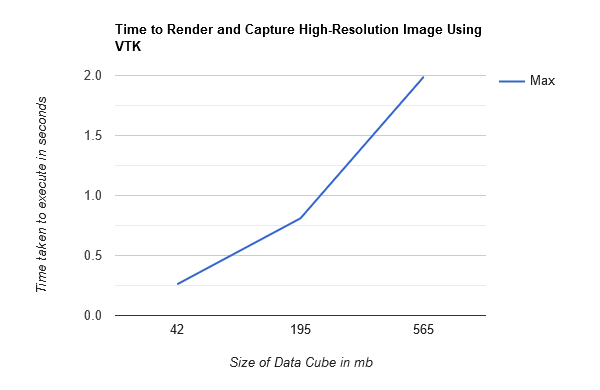
- The time taken to capture and render a screenshot of the full cube, given the parameters of the screenshot.
Results:
Time to generate 10mb LOD model
The method we used to implement the LOD model generation turned out to be the bottleneck of our
system. The algorithm executes sequentially, and a high-performant computer would likely show
similar increases in overhead as the size of the cube increases. Given more time, we would have
parallelized this function, and instead of observing the linear speed up that we did, we would
likely have achieved log(n) speedup.
The one saving grace of this bottleneck is that LOD
models are usually generated infrequently when using our application. In most cases, the user will
generate a model and interact with the same model for the majority of the time. Hence, this short
delay before displaying the cube is tolerable. However, a real-world implementation when dealing
with large cubes would require this function to be parallelized. The graph below details these
results:

The time taken to capture and render a high-resolution screenshot
The graph below shows the time taken to capture a screenshot on the server of the offsreen render of the full cube. It shows a linear increase in time as the size of the cube increases. We expected this result, as the time taken to render a volumetric data set is dependent on the processing power of the GPU that the rendering is done on. This test was conducted on a PC with a NVIDIA GeForce MX250 GPU, which has 4GBs of VRAM. A server will likely have access to much more powerful GPUs (which we recommend), which are becoming increasingly more affordable in todays GPU market. The server could also link several of them into a cluster, which would allow for much greater graphical processing power. This will allow for much faster rendering of screenshots and it can be expected to handle much larger cubes with acceptable render times.
