User-interface
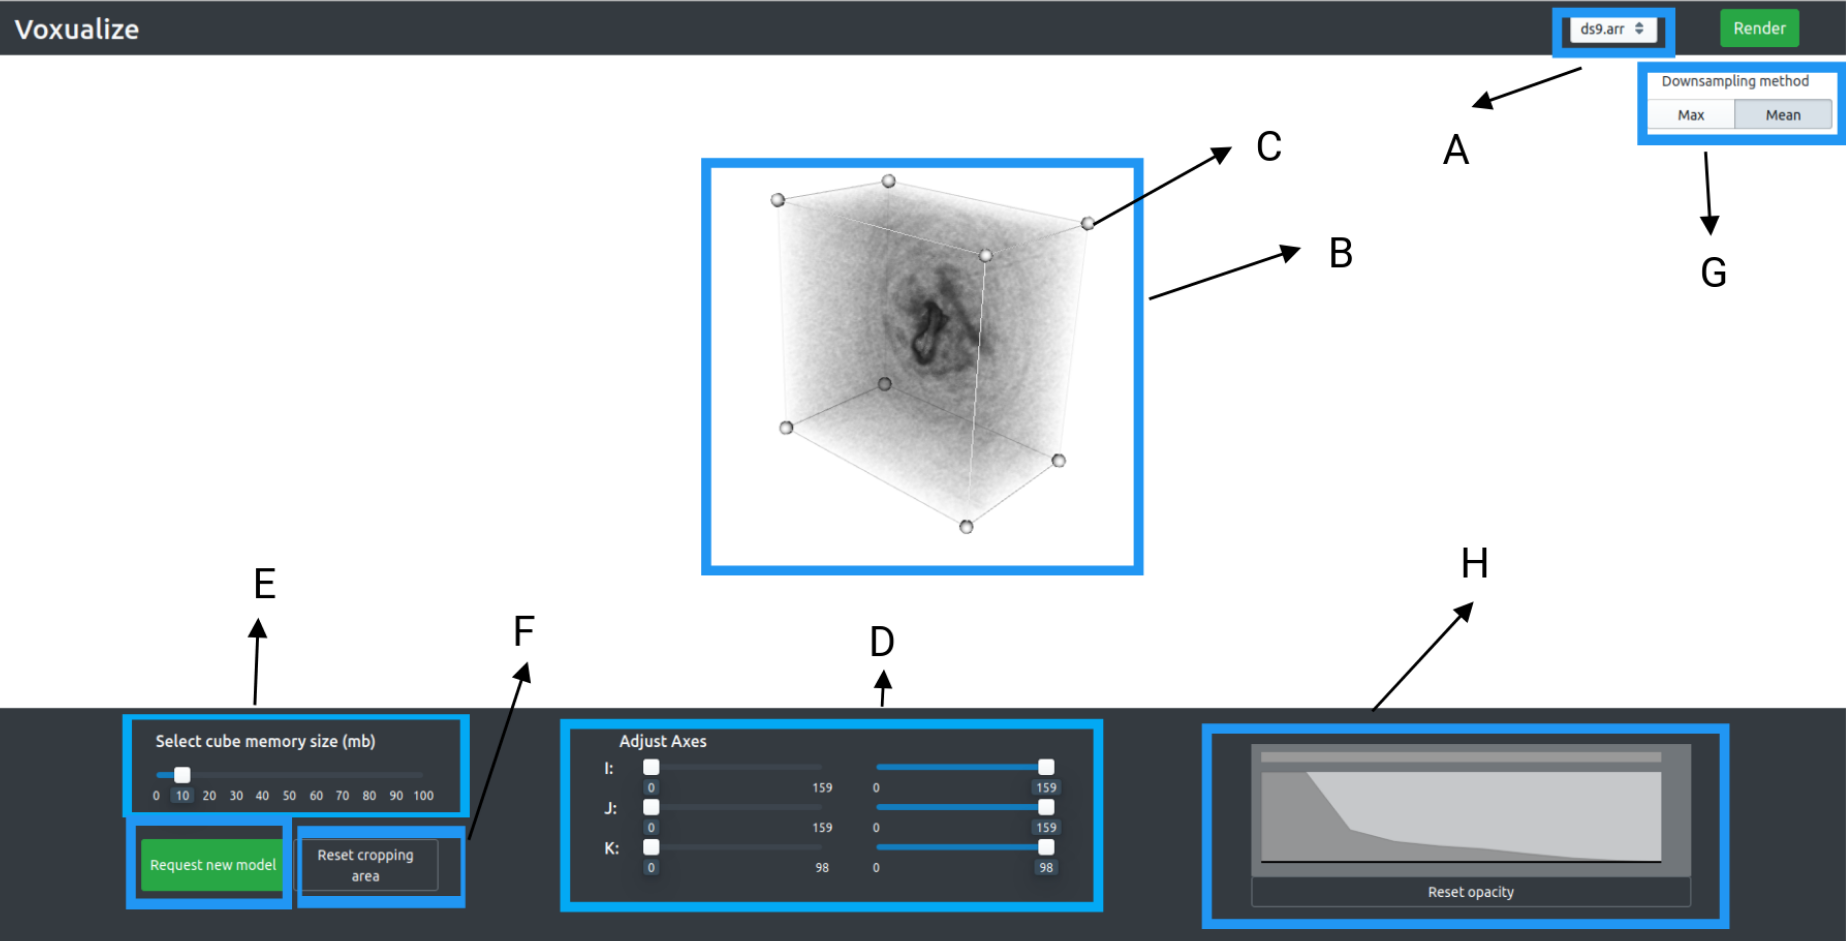
The user-interface is written in React, and is written as a single-page application. The diagram below is a screenshot of the user-interface after it has rendered an LOD model. The labels point out the key features of the user-interface.

- A: File selector - Used for selecting the file to visualize
- B: Viewing Area - This is the main area used to view the cube. When interacting with the cube, the user sees a downsampled level-of-detail (LOD) model of the cube. When the user stops interacting with the cube for around 300ms, a high quality image is sent from the server, replacing the LOD model.
- C: Cropping widget - Allows the user to resize the data cube as you see fit.
- D: Axes sliders - Allows a secondary way to resize the cube. C and D are mapped together
- E: LOD model slider- Allows the user to specify the size cube rendered by the frontend. This can make the LOD model more / less detailed depending on the setting.
- F: Reset cube button - Resets the cube to it's default cropping regions / transfer function settings etc.
- G: Sample type: - Allows the user to choose which sampling method to use for the LOD model
- H: Opacity widget - Allows the user to change the opacity transfer function, and updates the model accordingly. Includes a reset button to change back to the default opacity settings.
Evaluation methods
The main aim of the system was to provide a scalable solution to visualizing large data cubes. Two metrics were chosen to measure whether this was achieved:
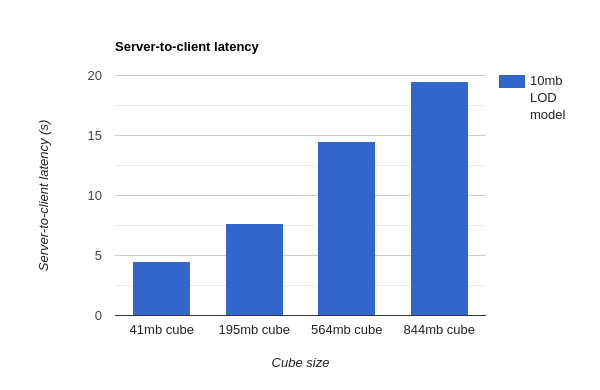
- Server-to-client latency - The amount of time between when the render button was clicked and when the first LOD model gets displayed to the user. Four different cube sizes were used in this measurement.
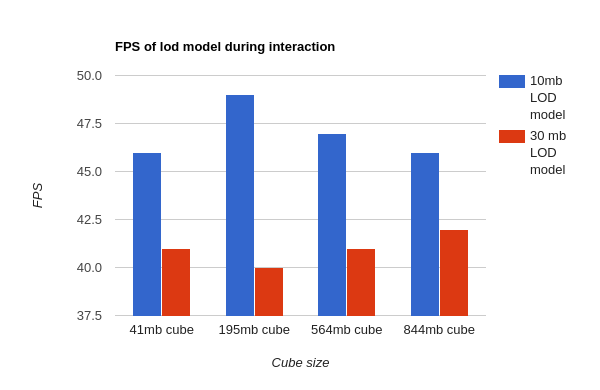
- Frames-per-second - The FPS of the LOD model when the user is interacting with it. A 10mb and 30mb LOD model of four different cubes were used for these tests. The cubes were interacted with and the FPS results were measured.
Results:
Server-to-client latency
The server-to-client latency showed workable speeds, but the latency linearly increased with cube size. This is a bit concerning when we consider having to render very large data cubes. It suggests that perhaps we need to rethink our downsampling approach. The graph below details these results.

Frames-per-second
The FPS results on the front-end were fairly promising, showing FPS values in the 40s range which is well within the FPS range needed for user-interaction. Increasing the LOD model size led to slight decreases in FPS but they were still well in the interactive range (above ~15 fps). Since the LOD models are unlikely to be very large in size, this was not a major concern. These results suggested that as long as the downsampling and transmission of data was done adequately, the LOD model could always be rendered at interactive frame-rates, regardless of the size of the cube. The bar graph below details these results.
