Vehicle
Overview
An Android application –MOVER (Mobile On-board Vehicle Event Recorder) – was designed and built with the purpose of detecting car accidents through the use of acceleration thresholds. Driving data was gathered and crash simulations were run. With this data, testing and analysis were conducted in order to find as accurate a threshold as could be reached to separate normal driving from accident situations. With this application, users can leverage their mobile devices, be they old or new, to improve road safety - for themselves, and their area as a whole.
Testing
Testing of the MOVER application was done through gathering drive data from car trips driven with an Android phone running the app, as well as crash simulations, performed with shopping trolleys. With these tests, normal driving acceleration patterns were recognised and categorised as well as various crash situations. Through the analysis of the test data, threshold acceleration values were reached that separated normal driving from certain collisions.
Crash Simulation Environment
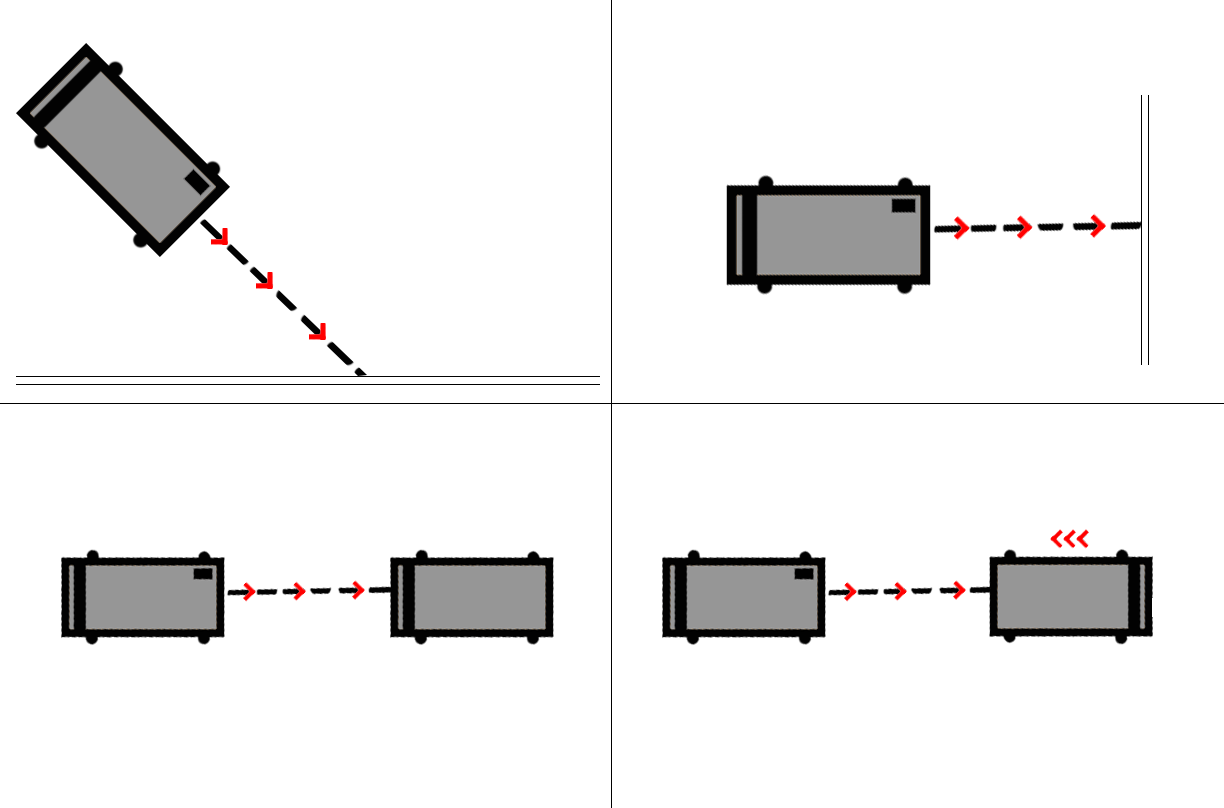
Real car crash data could not be used for analysis in the search for accurate threshold values to use for collision detection. Crash simulation data was gathered by crashing shopping trolleys in numerous different crash situations. It was decided that trolleys were the closest thing to cars that were available to crash. Although real car accident speeds could not be achieved with trolleys, data from trolley crashes could be extrapolated reliably to mimic the data that would be generated from a high speed crash. For the tests, a mobile device was fixed to a trolley, by means of cable ties, and the application was run on the device, recording all acceleration values, while the trolley was put through various different crash situations.
Results
While the application is running, acceleration values are logged to a local file on the device. Every 300 milliseconds, the maximum acceleration value measured for that window is written to file. These log files were used for the analysis of acceleration data gathered during testing.
Driving Data
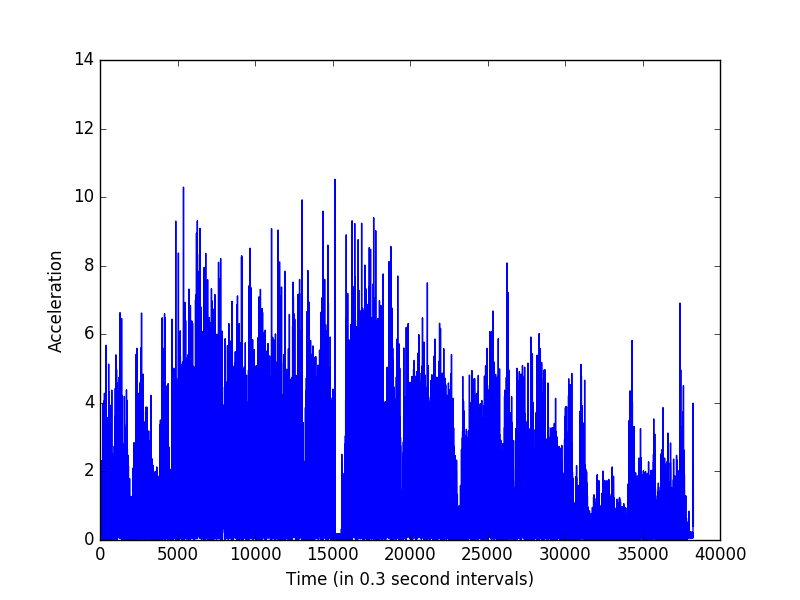
Normal, non-crash driving data were collected by running a number of tests where the application recorded acceleration values while driving certain distances in a car. Driving tests ranged in distance from 10km to 500km. All data were logged to a local file, and for analysis, the data were then graphed. The example graph below visualises acceleration data from a long-distance driving trip of approximately 3 hours. The x-axis represents each 0.3 second window that acceleration data was recorded at, and they-axis measures magnitude of acceleration (in m.s-2).A total of 10 tests drives were performed. This number was limited to the availability of a car. However, aggressive driving techniques were used in order to achieve higher than normal acceleration values during drives. Aggressive driving techniques included both accelerating from stand-still as quickly as possible (Pushing the accelerator to the floor), as well as hard breaking to stop.
Crash Simulation Data
Tests for crash situations were conducted by attaching a mobile device to a shopping trolley and acting out various crash situations. Two main crash situations were tested: collisions with a wall, and collisions with another trolley.Two separate crash tests were performed, with a total of 13 collisions. The speed at which collisions were tested ranged from 5km/h to 15km/h (fast walking to moderate running speeds). All data was logged, just as was done for the normal driving data, to a local file, and the data was then graphed. The graph below shows an example of a crash test graph, containing acceleration spikes from two separate collisions.In this example crash graph, there are clearly two acceleration spikes, which both correspond to crashes against a wall. The first spike is considerably larger than the second, and this is due to the different speeds at which collisions took place across the different crashes. The first collision was tested at running speed, approximately 15km/h, while the second crash only happened slow jogging speed, approximately 10km/h. This accounts for the different acceleration spikes shown on the graph
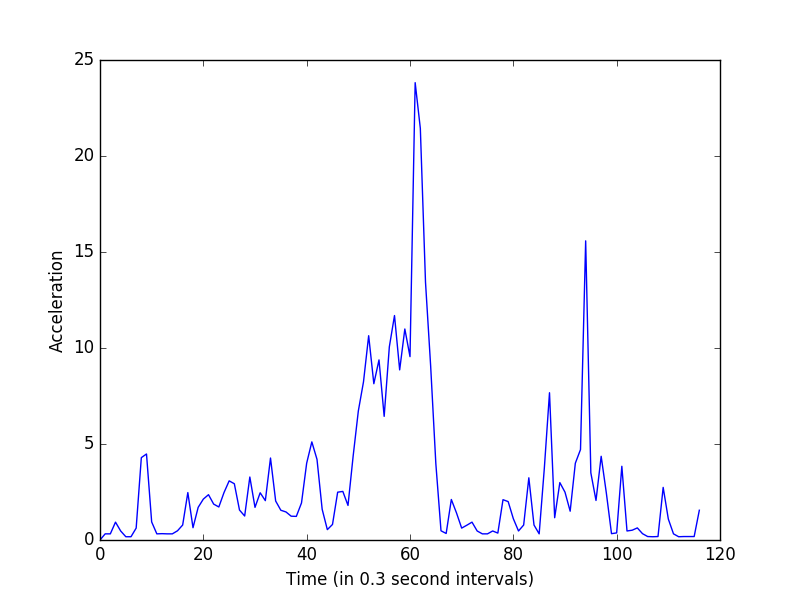
The maximum acceleration spike from a test crash was 23.82m/s2, while the minimum was 10.55m/s2. Although these values can be argued to be similar to values achieved with normal driving – especially for the minimum spike value – the tests were performed at very low speeds, and the results can be extrapolated to give an estimate of acceleration values achieved from similar crashes that occur at higher speeds.