Visualization Results
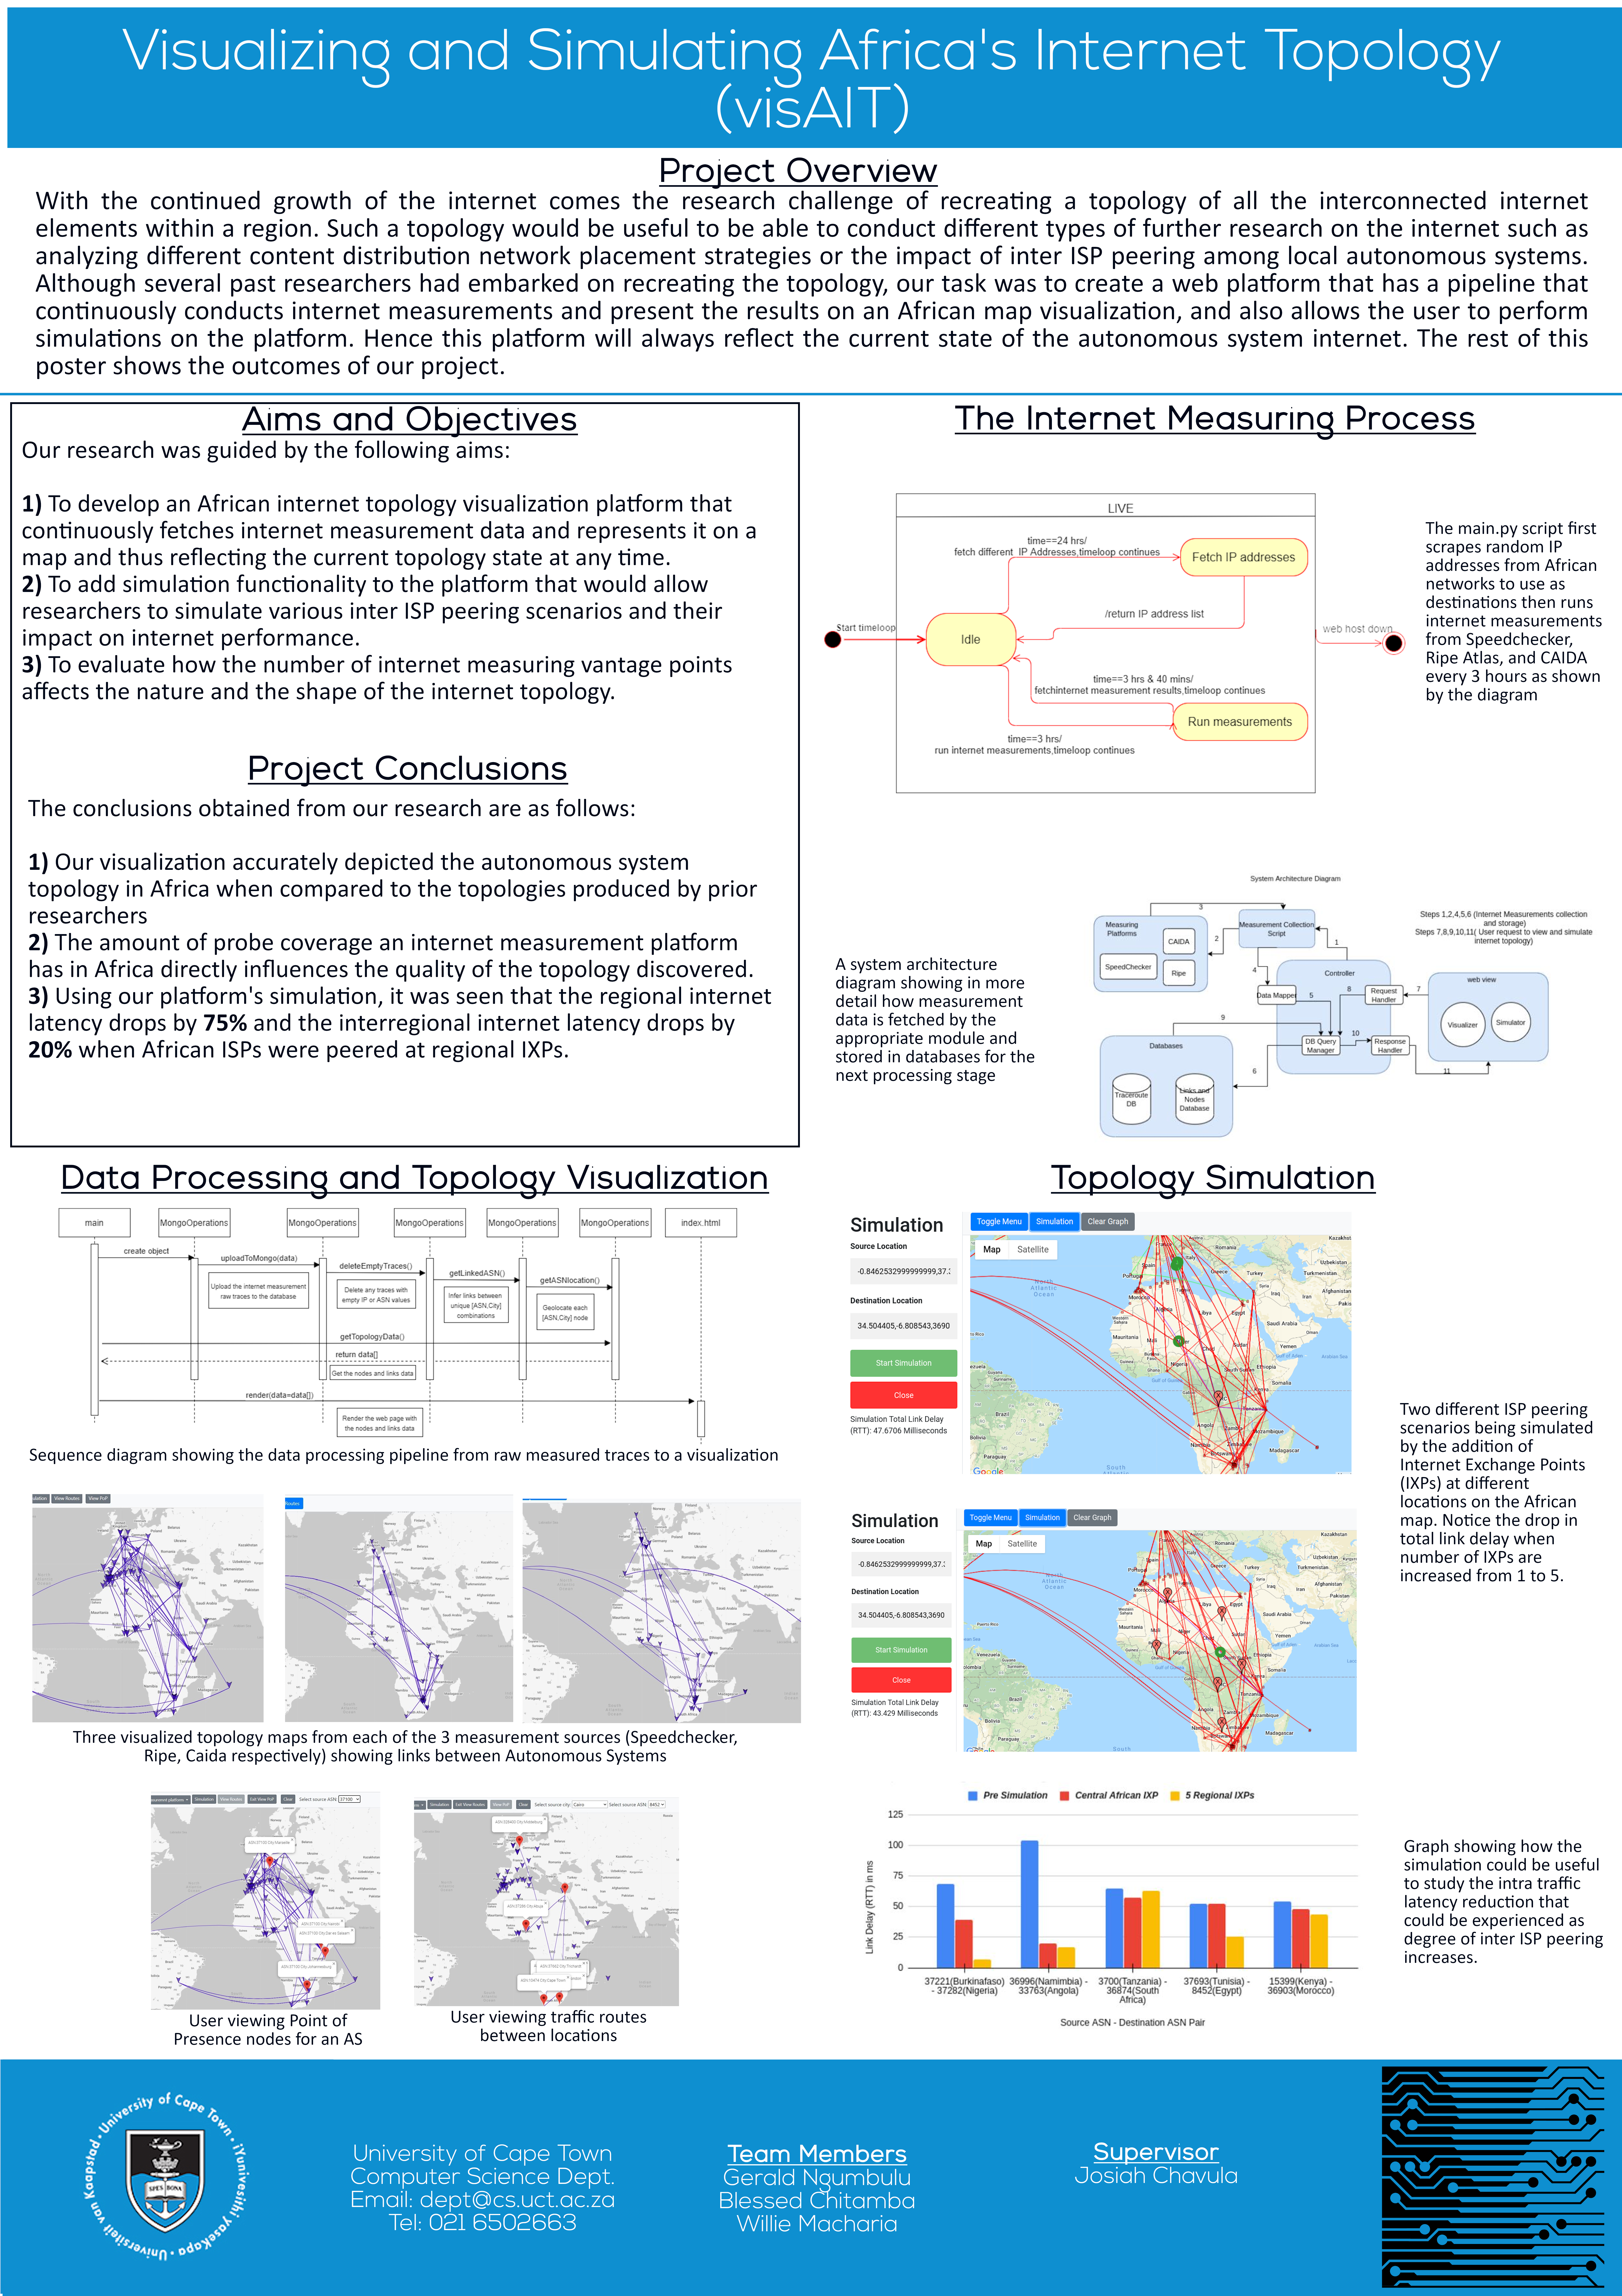
We managed to create a topology representation of the African internet at an AS level with reasonable accuracy. The topology structure was similar to those discovered by some of the past researchers we consulted during the literature review stage, showing us that our methodology was in the right direction. Below are 3 images of different topologies obtained from all 3 internet measurement platforms. As was part of the design requirements, the user can choose which measurement platform to view data from.
The platform also has features to allow one to view the particular point of presence cities for a selected Autonomous System Number (ASN), or to view the particular routes taken by traffic from a selected source to various destination cities. These features would be useful for a researcher to study traffic flow and peering among ASs. Furthermore, when zoomed out, the map only shows city level detail i.e all nodes in a particular city condensed into one node. When one zooms in, however, they are able to see the particular ASNs in that city.


