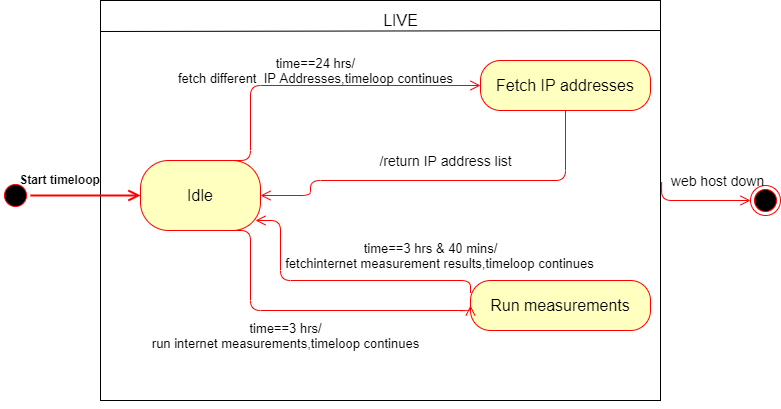
Internet measurement State machine diagram

The Internet Measurement process is a continuous process that is done using three internet measurement platforms: CAIDA Ark, RIPE Atlas and Speedchecker. The system built runs internet measurements, Traceroute and Ping, to each platform after every three (3) hours. The system then collects the data and puts the results into a MongoDB. The data is then used to visualize Africa's internet topology for each platform. The destination IP addresses are randomly selected from ASNs in Africa. This process of obtaining IP addresses is done after every 24 hours.

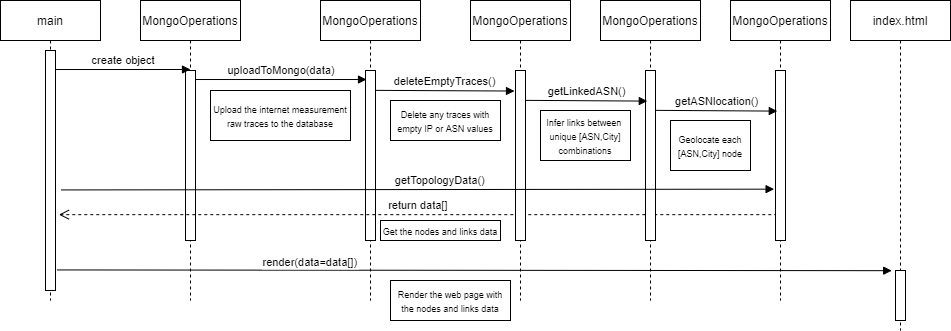
The data collected from the process explained above is raw measurements data and must be processed further for us to start drawing links and nodes on a map. The data comes as traceroute traces i.e sequences of source to destination paths and the IP addresses traversed through each path. All those individual traces need to be combined in order to come up with the graph data structure that will be used to create the topology. The entire process is summarized below in the sequence diagram.

Simulation of internet graphs involves adjusting the number of nodes or adjusting the number of edges [12] present on the graph. The adjustment can be done by removing or adding either nodes or the edges on the graph. The aim of such simulation is to test how the internet performance can be affected when different network conditions are introduced to internet topology. When a network condition is introduced, the topology is said to be under a certain scenario. To simulate the topology, the mapped topology is subjected to the condition which in turn changes the routing of the mapped nodes. Internet traffic is then sent from source to a selected destination and the link delay between the source and destination is measured and recorded. Internet topology mapped at AS-level may be simulated under the following conditions: adding an IXP node, adding links between nodes, removing links between nodes and removing nodes.

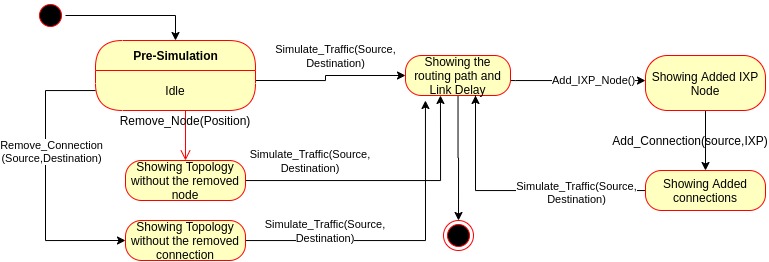
During pre-simulation phase, the topology is in idle state. When an node is removed from topology, the remove node method is invoked and the topology will transition to the state where the topology is shown without the removed node. When an IXP node is added to the topology, the add IXP node method is invoked and the topology transition to the state where the topology is shown with the added node. When a connection between two nodes is added to the topology, the add connection method is invoked and the topology transition to the state where the topology is shown with the added connection. When a connection between two nodes is removed from the topology, the remove connection method is invoked and the topology transition to the state where the topology is shown without the removed connection. At any given state, the simulate traffic method can be invoked and the topology will transition to the state where the routing route and the link delay is shown. This was important as any action done on the internet topology could be evaluated of its effect on internet performance.