Image segmentation is the process of identifying areas in an image according to some criteria. Tree segmentation, which refers to the identification of trees in images, is required to identify trees in DEMs as these are the areas where ground height must be estimated, using image segmentation techniques.
The aim of this project was to identify trees
in orchard DEMs. As no other data was used (such as visible spectrum aerial
photographs) and as the DEMs were of low-fidelity, accurate segmentation was more
difficult to achieve.
We aimed to investigate the usage of different segmentation techniques on DEMs. There are many characteristics of DEMs that affect segmentation accuracy, such as noise, tree spacing and land gradient, and these were looked at. A secondary aim was to compare the performance of the segmentation techniques with each other
Superpixels are a collection of similar, neighbouring pixels. Simple Linear Iterative Clustering (SLIC) is a way of grouping pixels into superpixels. SLIC works by electing k centroids in the image, evenly spaced apart. The Euclidean distance between each pixel and each centroid is calculated - some optimisation is used to limit the number of calculations done. Pixels are assigned to their closet centroid, forming a cluster, seen in Fig. 1. The centre of each centroid is calculated and this becomes the new centroid. Pixels are assigned to centroids again and this process repeats until centroid positions no longer change or a certain iteration count has been reached.
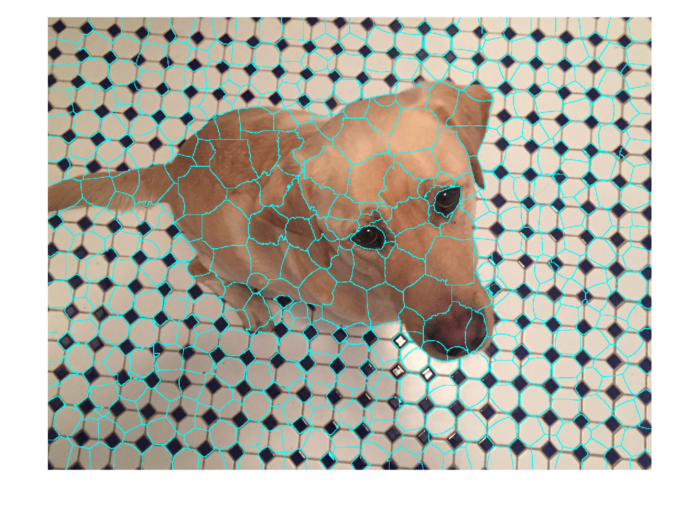
Figure 1: An image showing SLIC cluster boundaries in cyan.
Watershed segmentation is an image processing technique that segments an image based on the concept of watersheds and catchment basins. Markers are placed in low-lying regions (it is up the user to decide what constitues as a low or high region) and a "flood" is performed where neighbouring pixels are assigned to the basin formed by the marker. When clusters meet (in high-lying regions), they form a watershed along their border. These watersheds segment the image.
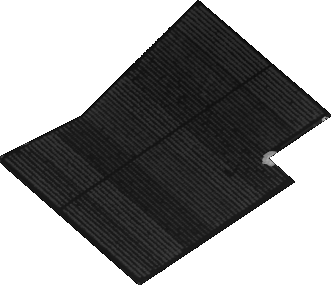
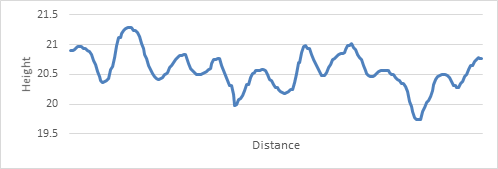
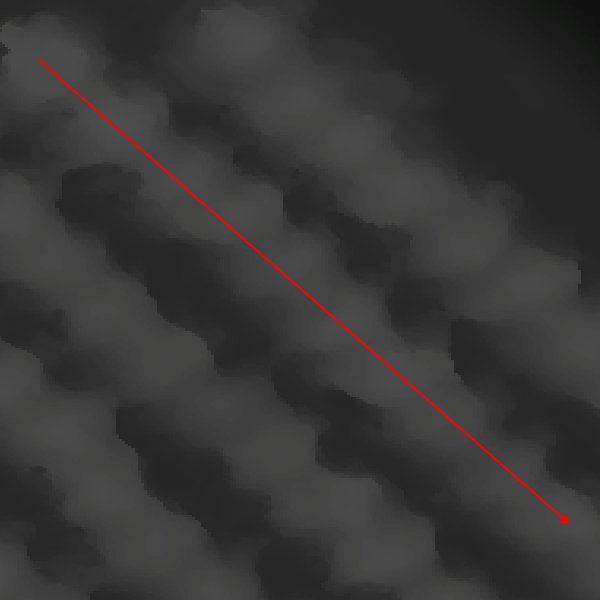
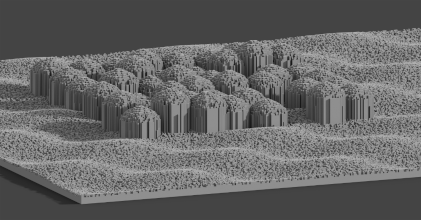
Two datasets were used. The first of which, provided by Aerobotics, consisted of greyscale, 32-bit float TIFF images (seen in Fig. 2). These DEMs presented a challenge to the segmentation algorithm due to their low fidelity (the height profile of a sample of the DEM can be seen in Fig. 3). The second set of DEMs were produced by the DEM Generation subproject (seen in Fig. 4). The aim of this was to create a variety of DEMs to test the segmentation algortihm on different types of terrain.
Figure 4: A synthetic DEM from the DEM Generation subproject,
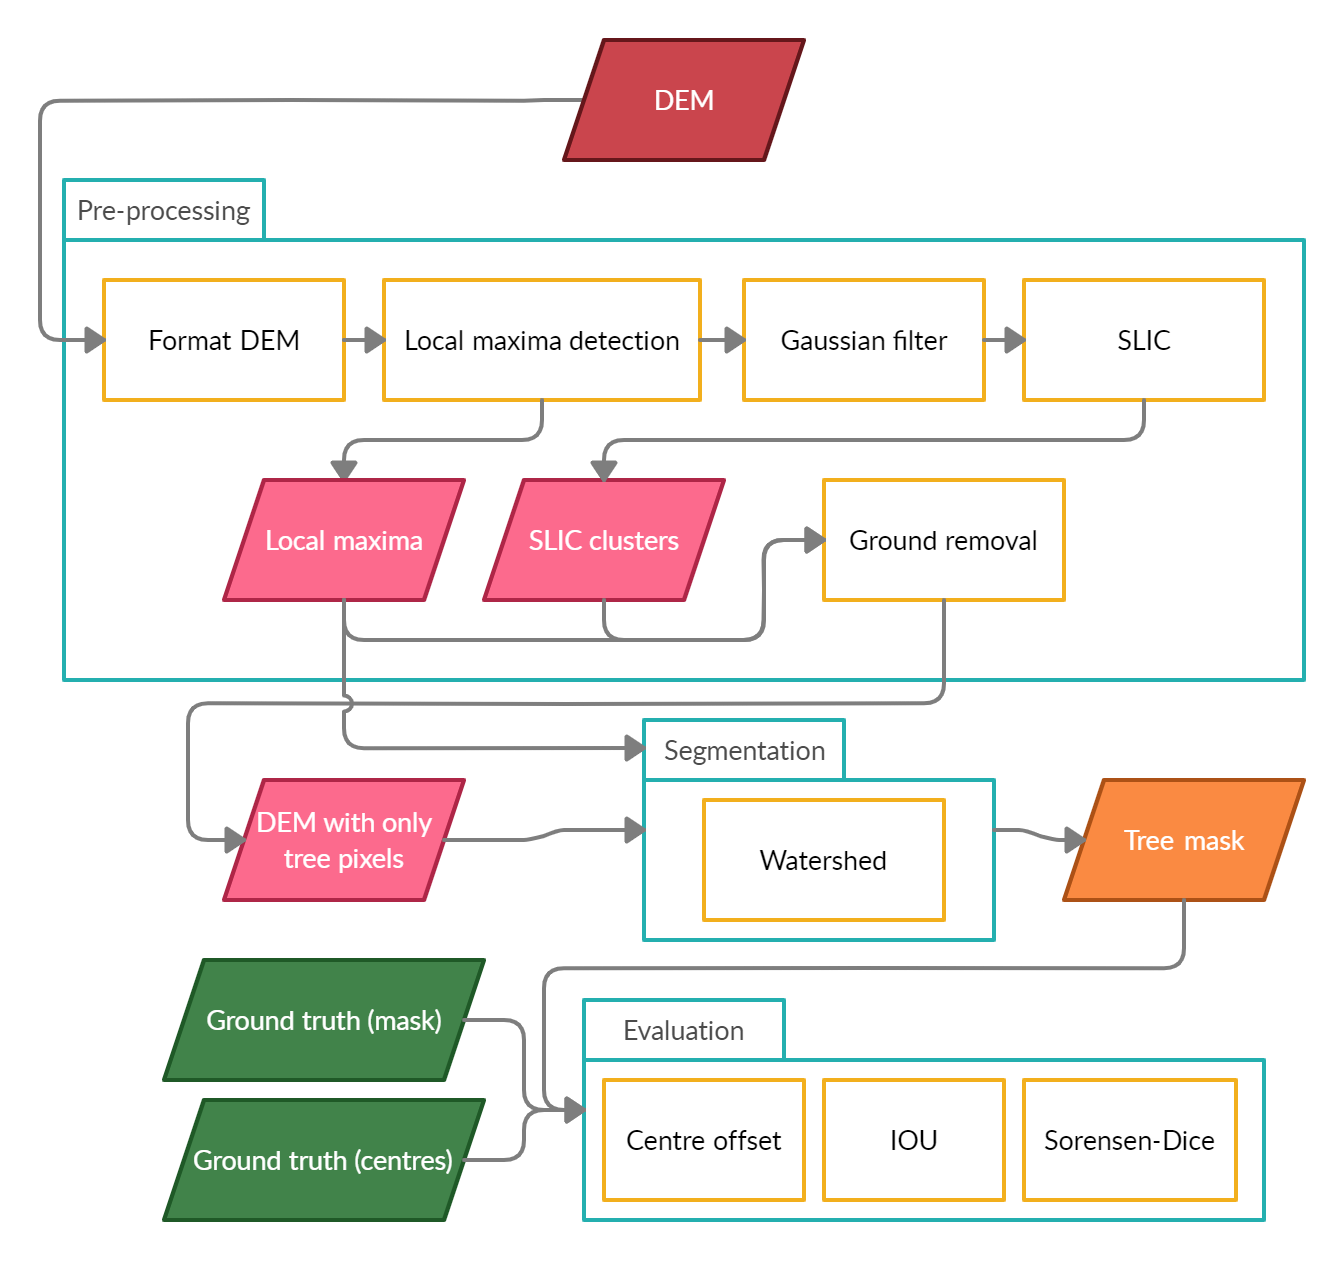
A series of steps was required to perform the tree segmentation operation. DEMs underwent preprocessing to increase to increase the accuracy of segmentation. A system diagram can be in Fig. 5.
Figure 5: System diagram showing the preprocessing, segmentation and evaluation frameworks.
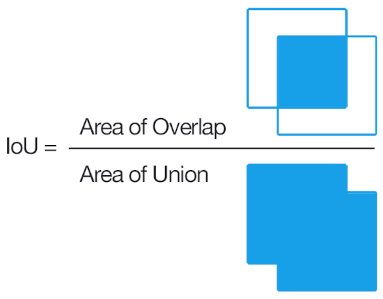
To evaluate segmentation, the results produced from this system must be compared with a ground truth, which is an image that has already been segmented with a higher accuracy than what can be produced by the system. There were 4 tests performed:
Figure 6: The IOU equation.
Marker detection was better in disperse orchards. The window size of the local maxima dectection operation, compared to the spacing of the trees, would have affected this.
Terrain | Total Trees | % of Trees Identified | Mean Distance from Centre (in Pixels) | Standard Deviation |
---|---|---|---|---|
Flat | 711 | 98.312 | 0.308 | 0.325 |
Gentle | 530 | 95.849 | 0.350 | 0.440 |
Steep | 540 | 95.926 | 0.376 | 0.430 |
Large-hilled | 466 | 82.403 | 1.257 | 2.366 |
Small-hilled | 568 | 94.014 | 0.403 | 0.479 |
Table 1: Table showing the results from the tree centre detection.
The algorthm performed better in smooth trees (seen in Fig. 7) as watershed is sensitive noise. The gradient of terrain was also shown to have an impact on segmentation accuracy, as the algortihm produced more accurate segments in the flat terrain, where 73% of trees have an IOU of 70% or more.
Figure 7: A series of graphs showing the percentages of trees that obtained a certain IOU percentage (shown in the legend), when using different subcategories of terrains in the flat terrain (a), gentle terrain (b), steep terrain (c), large-hilled terrain (d) and small-hilled terrain (e).
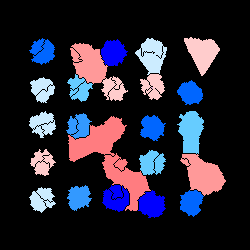
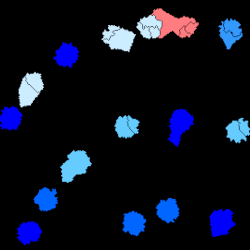
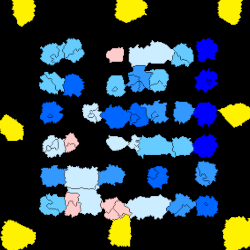
From Fig. 8 it can be seen that the algotihm produces many false positive segments in small-hilled terrain, that is not shown in Fig. 7, that results in its overall IOU (24.3%) being much lower than its mean IOU per tree (80.2%), in one case.
Figure 8: A series of images showing the tree masks produced, and their IOU percentage (as shown in the legend above), for the flat terrain (a), steep terrain (b), large-hilled terrain (c) and small-hilled terrain (d).
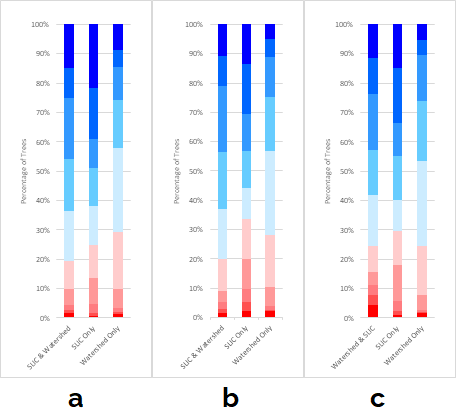
From Fig. 9, it can be seen that segmentation accuracy is best when using both SLIC and watershed. SLIC alone performs better than watershed alone, as watershed is more sensitive to noise. As SLIC has a much larger execution time than watershed, watershed alone can used in time sensitive circumstances.
Figure 9: A series of graphs showing the percentages of trees that obtained a certain IOU percentage (shown in the legend), when using a certain segmentation technique, for the flat terrain (a), gentle terrain (b) and small-hilled terrain (c).
The results of the segmentation varied depending on the DEMs used. In a best case scenario, where trees are smooth topped, a mean IOU per tree of 88.16% can be achieved while in the worst case scenario, in a DEM with noisy, compacted trees on a large hill, a mean IOU per tree of 54.3% can be achieved. As a result, this system may be usable on orchards with spaced-out identical trees. However, more work is required to make it robust enough to operate with uneven terrain. Using a combination of SLIC and watershed has been shown to be more effective than using only one of them.
created with
Website Builder Software .