A significant issue with developing height
estimation methods for DEM data is the lack of truth measurements that confirm
the results produced by these methods. In our case, methods that determine
where trees are in an image and predict the ground heights below them lack the
true ground heights to compare the image processing results to.
Recording data such as the ground heights
over a landscape requires expensive equipment or is highly time consuming for
large areas of farmland. For this purpose, we generate our own DEMs digitally
where we can store all the relevant ground and tree data that we need to test
the accuracy of image processing methods such as tree segmentation and ground
estimation.
Tree segmentation refers to determining
which pixels in an image belong to a tree object and which pixels belong to
simply ground or other non-tree objects. Tree data in DEMs is represented by
the value of a tree pixel in a DEM image. Ground estimation refers to
predicting the height of the ground where a tree is found. For ground
estimation our produced DEMs showed that interpolation struggles with sharp
changes in the slope angle.
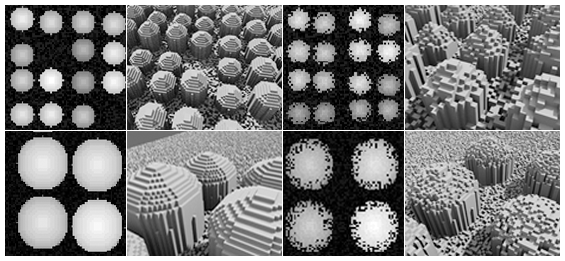
Figure 1: A series of DEMs from 2D and 3D perspectives.
We aimed to generate DEMs which were
sufficiently complex and variable to represent tree orchards on a large area of
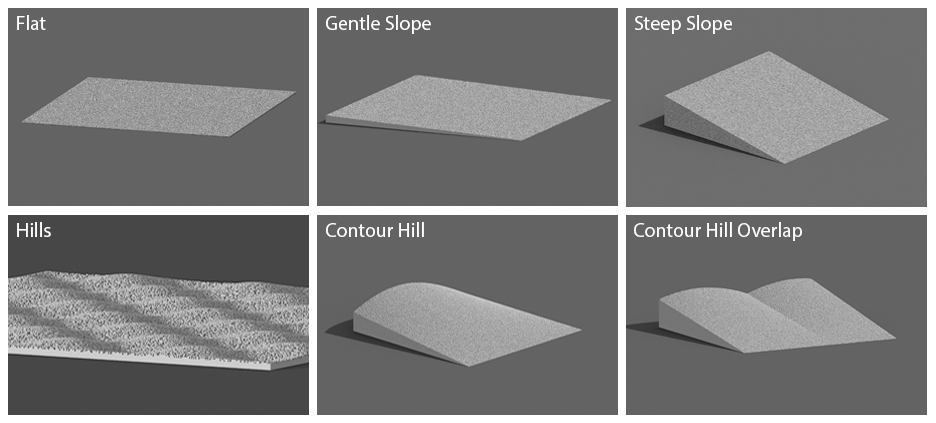
land. The underlying landscapes that we produced needed to cover several
features that are present in real-world tree orchard landscapes. Features such
as gradient slopes, bumpy ground surfaces and steep hills and ditches needed to
be simulated. The positioning of the trees that we added to these underlying
surfaces also needed to be in a manner that is found in real-world tree
orchards. The patterns in which we added trees aimed to simulate both neat
uniform rows of trees that are usually found on large monocrop orchards grown
on flat land.
For hillier orchard farming we aimed to
position trees in a manner that follow the contour lines of hills. For the
actual height data that we added based on our tree positioning to represent
trees we needed to add data that closely resembled that of a real-world DEM tree
object.
Along with trying to create DEMs that
simulate various features found in real-world DEMs we needed to further create
extreme versions of these that ‘stress’ test the image processing methods. This
way we were able to discover pitfalls in these methods and found improvements
that could be made to them. For this purpose, some DEMs were created where the
landscape was highly variable and sometimes infeasible for tree orchard
farm.
Figure 2: A series of DEMs produced by the system.
We produced different variations of tree
orchard DEMs based on landscape types, tree types and growth patterns. Above
are 3 examples of the 30 total generated 30 DEMs in which we tested external
image processing methods on with several experimental DEMs which were used in
designing DEMs and testing specific aspects of the image processing methods.
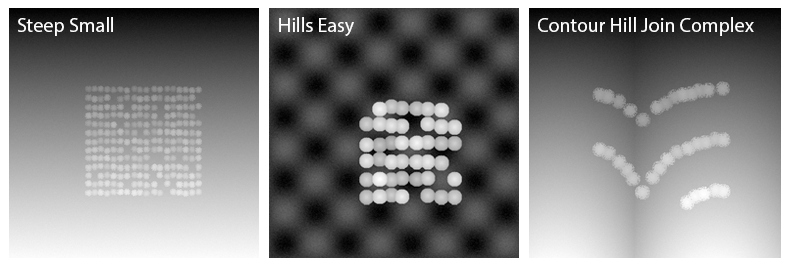
For landscapes we created 6 different variations
(see landscape variations below). To four of these landscapes we added trees in
uniform rows of trees and for the remainder we grew trees along contour lines. We
designed a simple type tree with a smooth tree canopy and a complex type tree
with a varying, bumpy canopy which also had holes and fraying near the edges. The
trees added were done so in 5 different standard variations using a combination
of different sizes and, two tree types and one variation where tree canopies
did not overlap or touch each other and were grown separated by a gap.
Figure. 3: A series of terrain used in the DEMs.
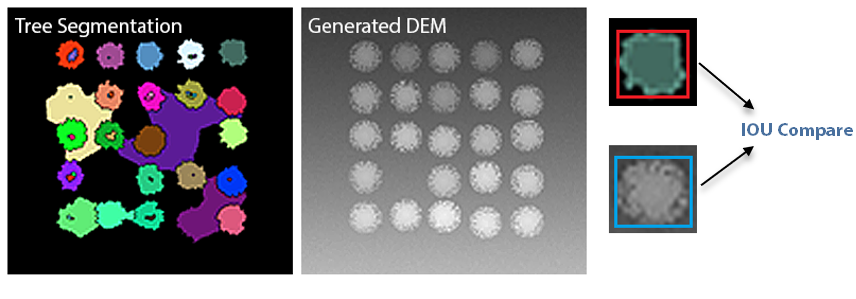
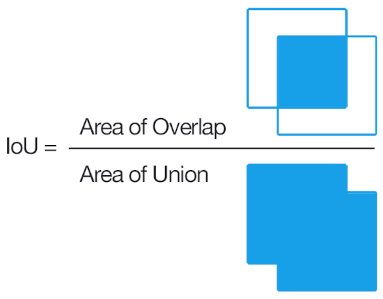
Along with generated DEMs we performed evaluations on the results of the tree segmentation and ground estimation versus the true data for the generated DEMs. For evaluating tree segmentation, we computed the Intersection over Union (IOU) for the bounding boxes of trees in the generated DEM versus the bounding boxes of trees in the tree segmentation result. This resulted in showing us how successful the tree segmentation was in estimating where the trees were on the image.
Figure 4: An image showing the results of a tree segmentation operation performed on a DEM and IOU equation.
Most IOU results indicated that tree segmentation struggles with any image that has multiple hills which have a local maxima height. This was most occurrent in our ‘Hills’ Type landscape which had multiple small low lying hills separated by ditches.
Figure 5: Graph showing IOU averages by landscape type.
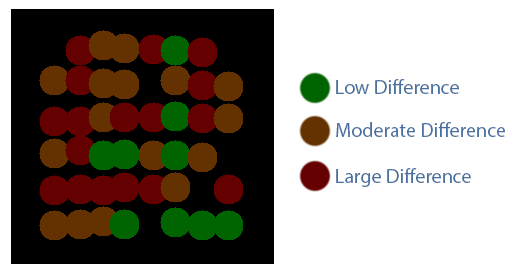
Ground estimation was evaluated by the average difference between the estimated ground height versus the true ground height over the areas of the image that were estimated. Ground estimations were deemed good with an average height difference of below 0.5, moderate for between 0.5 and 2 and bad for a difference above 2.
Figure 6: An image showing the results of a ground estimate operation performed on the DEM.
Similarly to segmentation, ground estimation struggled the most with the ‘Hills’ type landscape, with significantly larger height differences to in the estimated heights versus the actual heights that should have been found. This may be due to quick changes in the slope angle affecting the interpolation used in ground estimation.
Figure 7: Graph showing ground estimate and true ground average difference by landscape.
Our generated DEMs were able to effectively find deficiencies in tree height estimation algorithms, however more rigorous testing could have been done especially with more variations of landscapes like the ‘Hills’ type landscape. For tree segmentation the produced DEMs found that densely packed trees were difficult to predict and many low-lying hills affect watershed methods negatively. For ground estimation many changes in slope angles prove difficult when trying to interpolate heights.
created with
Website Builder Software .