Virtual Panning
Panning Component
By Jared Norman
Background information
A simplified model of how videos are stored in the computer is that videos are an audio file together with many images which are displayed in a sequence to show a video. These images are referred to as frames. The videos we were using showed 25 frames every second. We say the frame rate is 25 fps.
The tracking component locates the lecturer in each frame, giving a coordinate. The result of this component is a sequence of these locations.
The task of the panning component is to take the stitched frame together with the coordinates from the tracker and crop each frame in the input video in such a way that the resulting video simulates panning. Here is an example of a stitched frame:
Here is an example of how the panning component may decide to crop this frame:
We can plot the locations from the tracker in a graph to get a strong geometric interpretation of the problem which the panning component must solve. We call these locations ROI points. ROI is an acronym for region of interest. Here we ignore the y coordinate for simplicity:
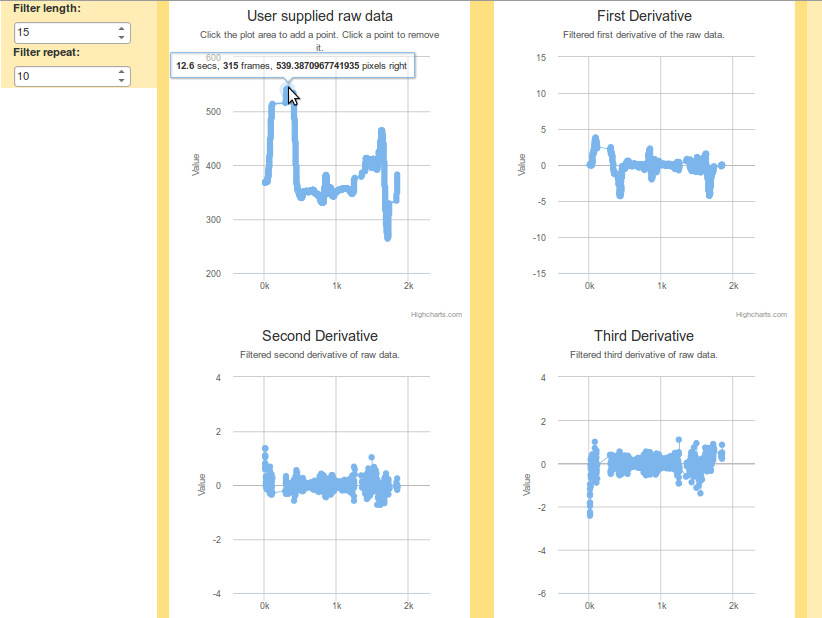
One can see here that there is a fair amount of jittering going on. We are interested in a more general description of the lecturer's location. One early attempt to analyse tracking data involved creating an interactive web-based tool. This tool allows the user to smooth the data and its derivatives.
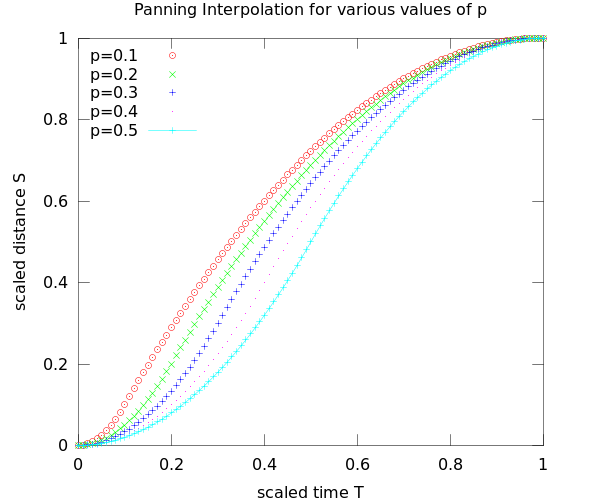
When we pan, we would like a motion which accelerates for some fraction of the time (say p) and decelerates for the rest of the time. Such a construction has been used in other similar systems. Here is a graph of the function for various values of p:
Snakes on a Plane
This function looks a little like a snake. Given the geometric interpretation we saw earlier, we can phrase the problem of constructing a set of panning functions during the video as fitting snakes on a plane. Here is an example of what that looks like geometrically:
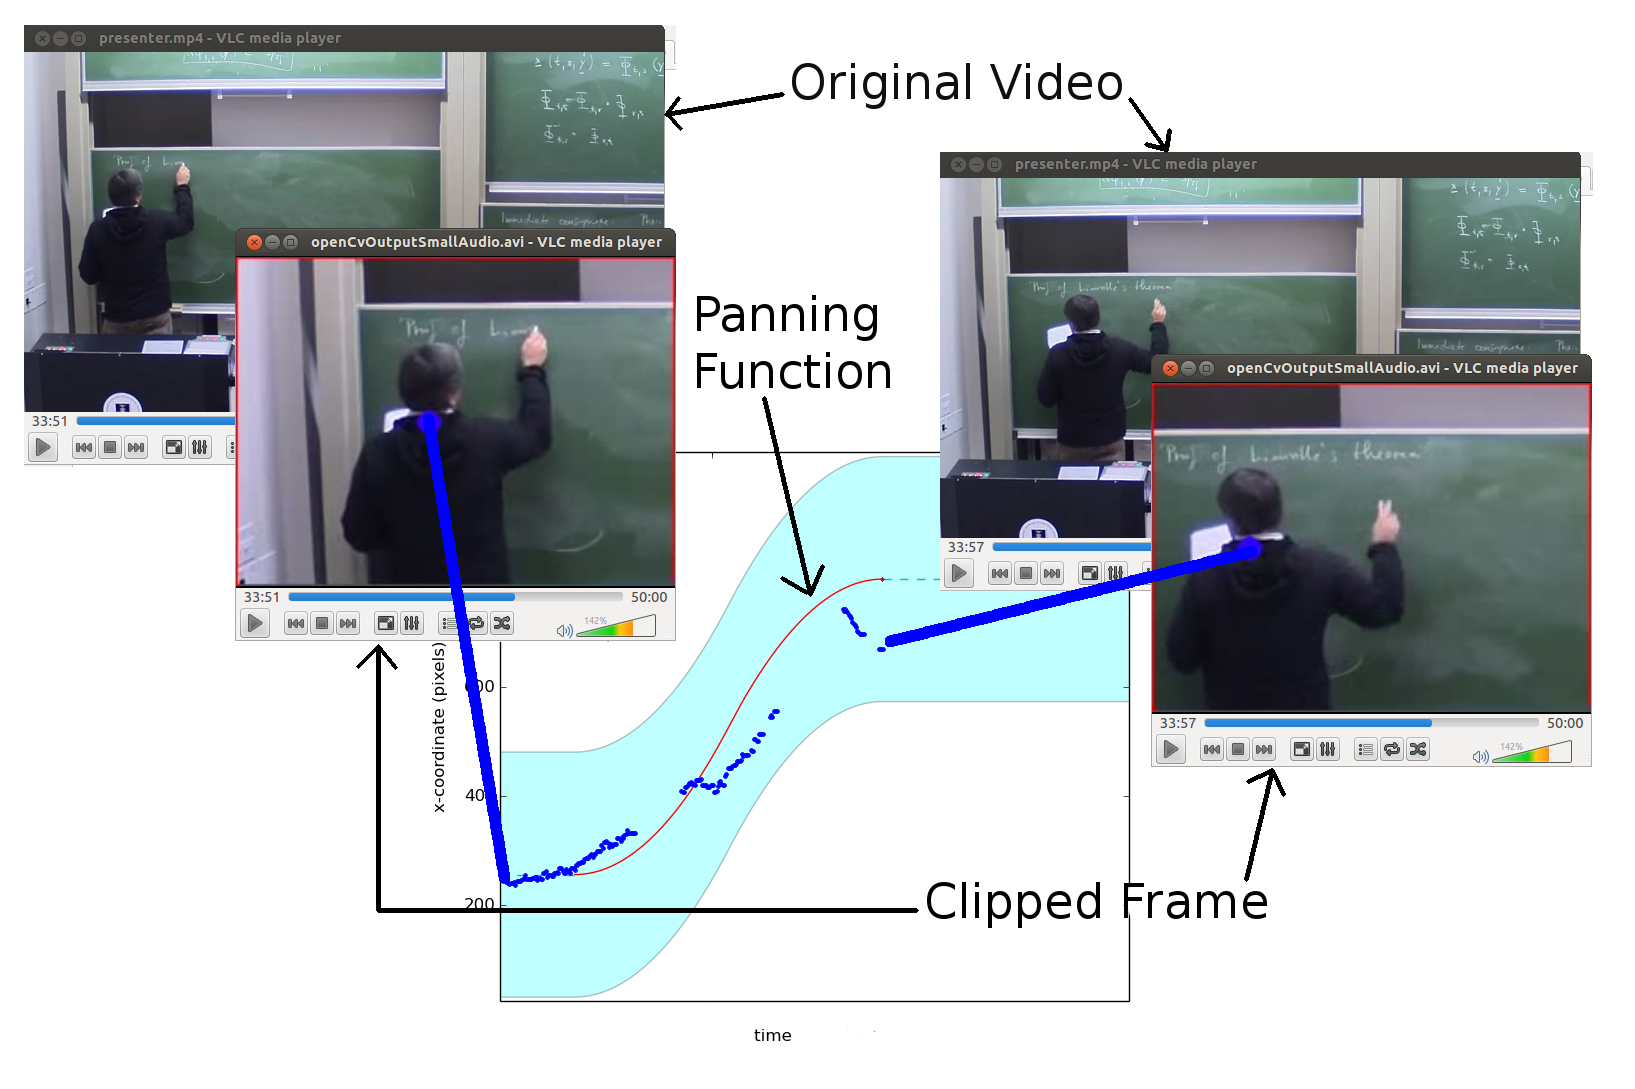
The light blue band represents the clipped frame, so if the ROI points (dark blue points) are in the light blue band, then the lecturer is presumably in the clipped frame.
So the problem can be thought of as fitting snakes in the plane such that most ROI points (perhaps thought of as passengers) are within reach of some snake at any point in time. The use of the word “most” here is taking into account that we don't want to put too many snakes on the plane since this corresponds to panning too frequently. Furthermore, our snakes should not be too young (small snakes correspond to quick pans which distract the viewer) and the snakes should not be too old (long pans get distracting too). Lastly, and perhaps where the analogy starts to fail, we don't want to be out of reach of some group of passengers that is too large. This is because, if we are panning and at some stage we lose the lecturer for a long period of time, that is much worse than losing them for short periods of time, even if we lose them for a short period of time quite often.
Testing
The properties which are (un)desirable to panning were cast into mathematical functions and used to evaluate our panning function. Our algorithm fits a panning function to ROI data with the use of two parameters, called x and y thresholds. We can plot each of the metrics as a function of these thresholds.

More details of these metrics can be found in the report, but what is important here is that we typically want to minimise these. Geometrically this means we want to be closer to the blue colours and further from the red ones. Furthermore, we can ask for certain desirable features by fitting inequalities to these graphs. For instance, if we want that the “Panning Length Penalty” is less than 15, we might fit a line above which the penalty is less than or equal to 15. These inequalities give us a feasible region. We know then that picking parameters within these inequalities will give us desirable pans.
Such a process is well known. It is called Linear Programming. Several well known algorithms can do this automatically. We thus concluded that this method of optimising parameters for our proposed algorithm made the algorithm more robust.
Our algorithm was implemented into a panning component which forms part of the virtual panning system.
Results and Conclusion
We found that our algorithm was able to run on the order of one second. Creating the new video is a linear operation given the points from the algoritm, so the speed is adequate for the needs of CILT.
The implementation allows flexibility through the abstraction of a clipped frame as a class.
The panning function developed by our algorithm is subject to further analysis, and many avenues for future work were mentioned in the report. We have shown how the constraints can be cast mathematically, and possibly further constraints may be cast in the future. Below is 6 minutes of selected output from the panning component.