Overview
The primary purpose of the client/frontend system is to visualise the data received form the server in the forms of image and volume data and to handle and process user interaction with the data.
The client Subsystem was constructed using the Vue.js javascript application framework and allows for easy creation of modular components. Additional packages for functionality can easily be added with a package manager like NPM, some of the packages that were used are vtk.js which is used for client-side data visualisation and is the JavaScript extension of VTK library that is implemented on the server-side system. The Bootstrap CSS package was used to improve the overall aesthetic and user experience compared to default HTML elements. To facilitate the connection between the client and the server JavaScript WebSocket are used to send and receive data without having to rely on singular HTTP requests and responses, allowing the client to make a single request and receive multiple responses.
The client will primarily receive images of fixed size in the implementation this size is 1080 pixels and 720 pixels and or one to two data cubes of a fixed which is 64 by 64 by 64 data points per axis. These dimensions limit the amount of data that the user will receive, the dimensions can be increased of decreased and limit the amount of data the client computer will have to process during its use.
User Interface
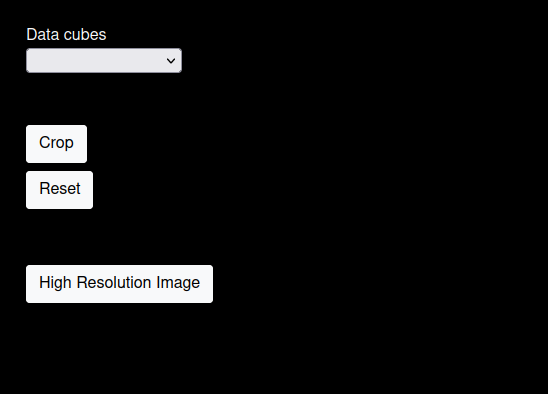
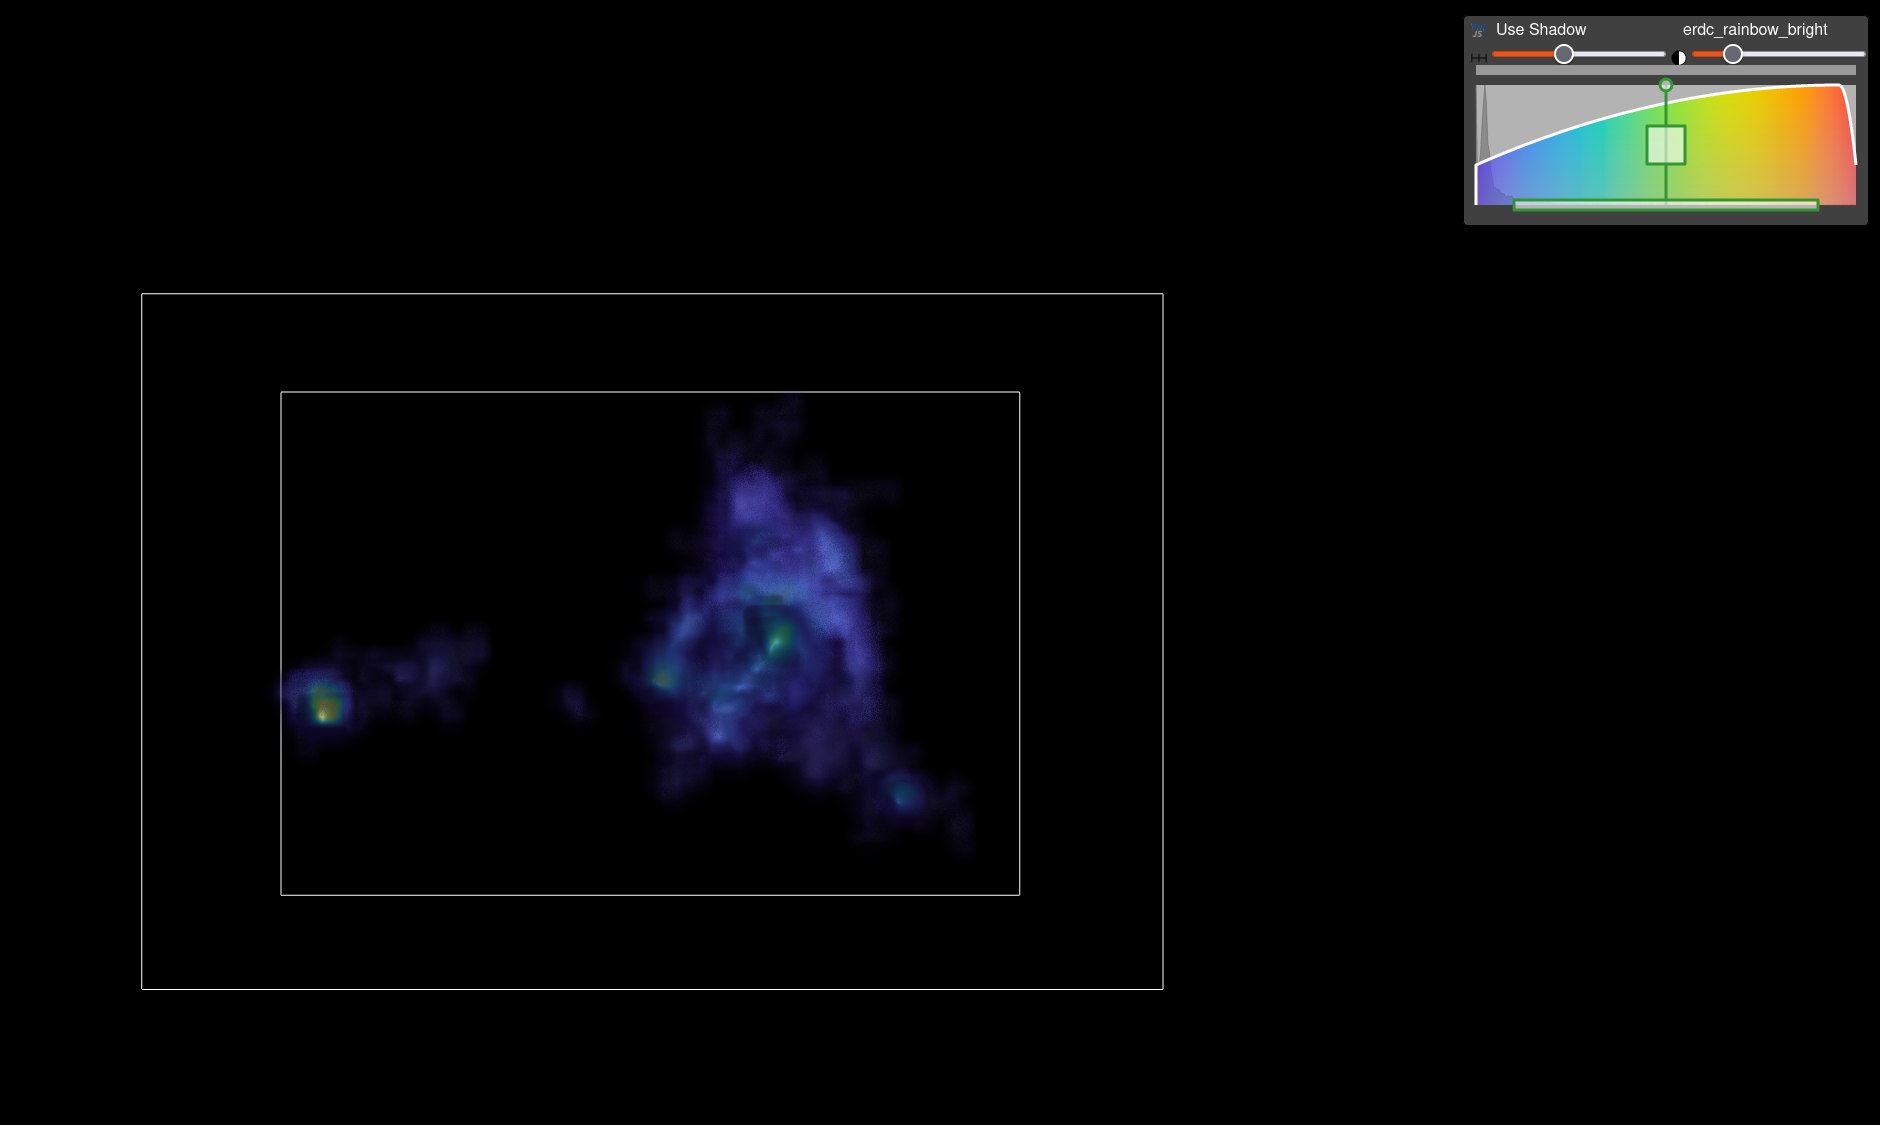
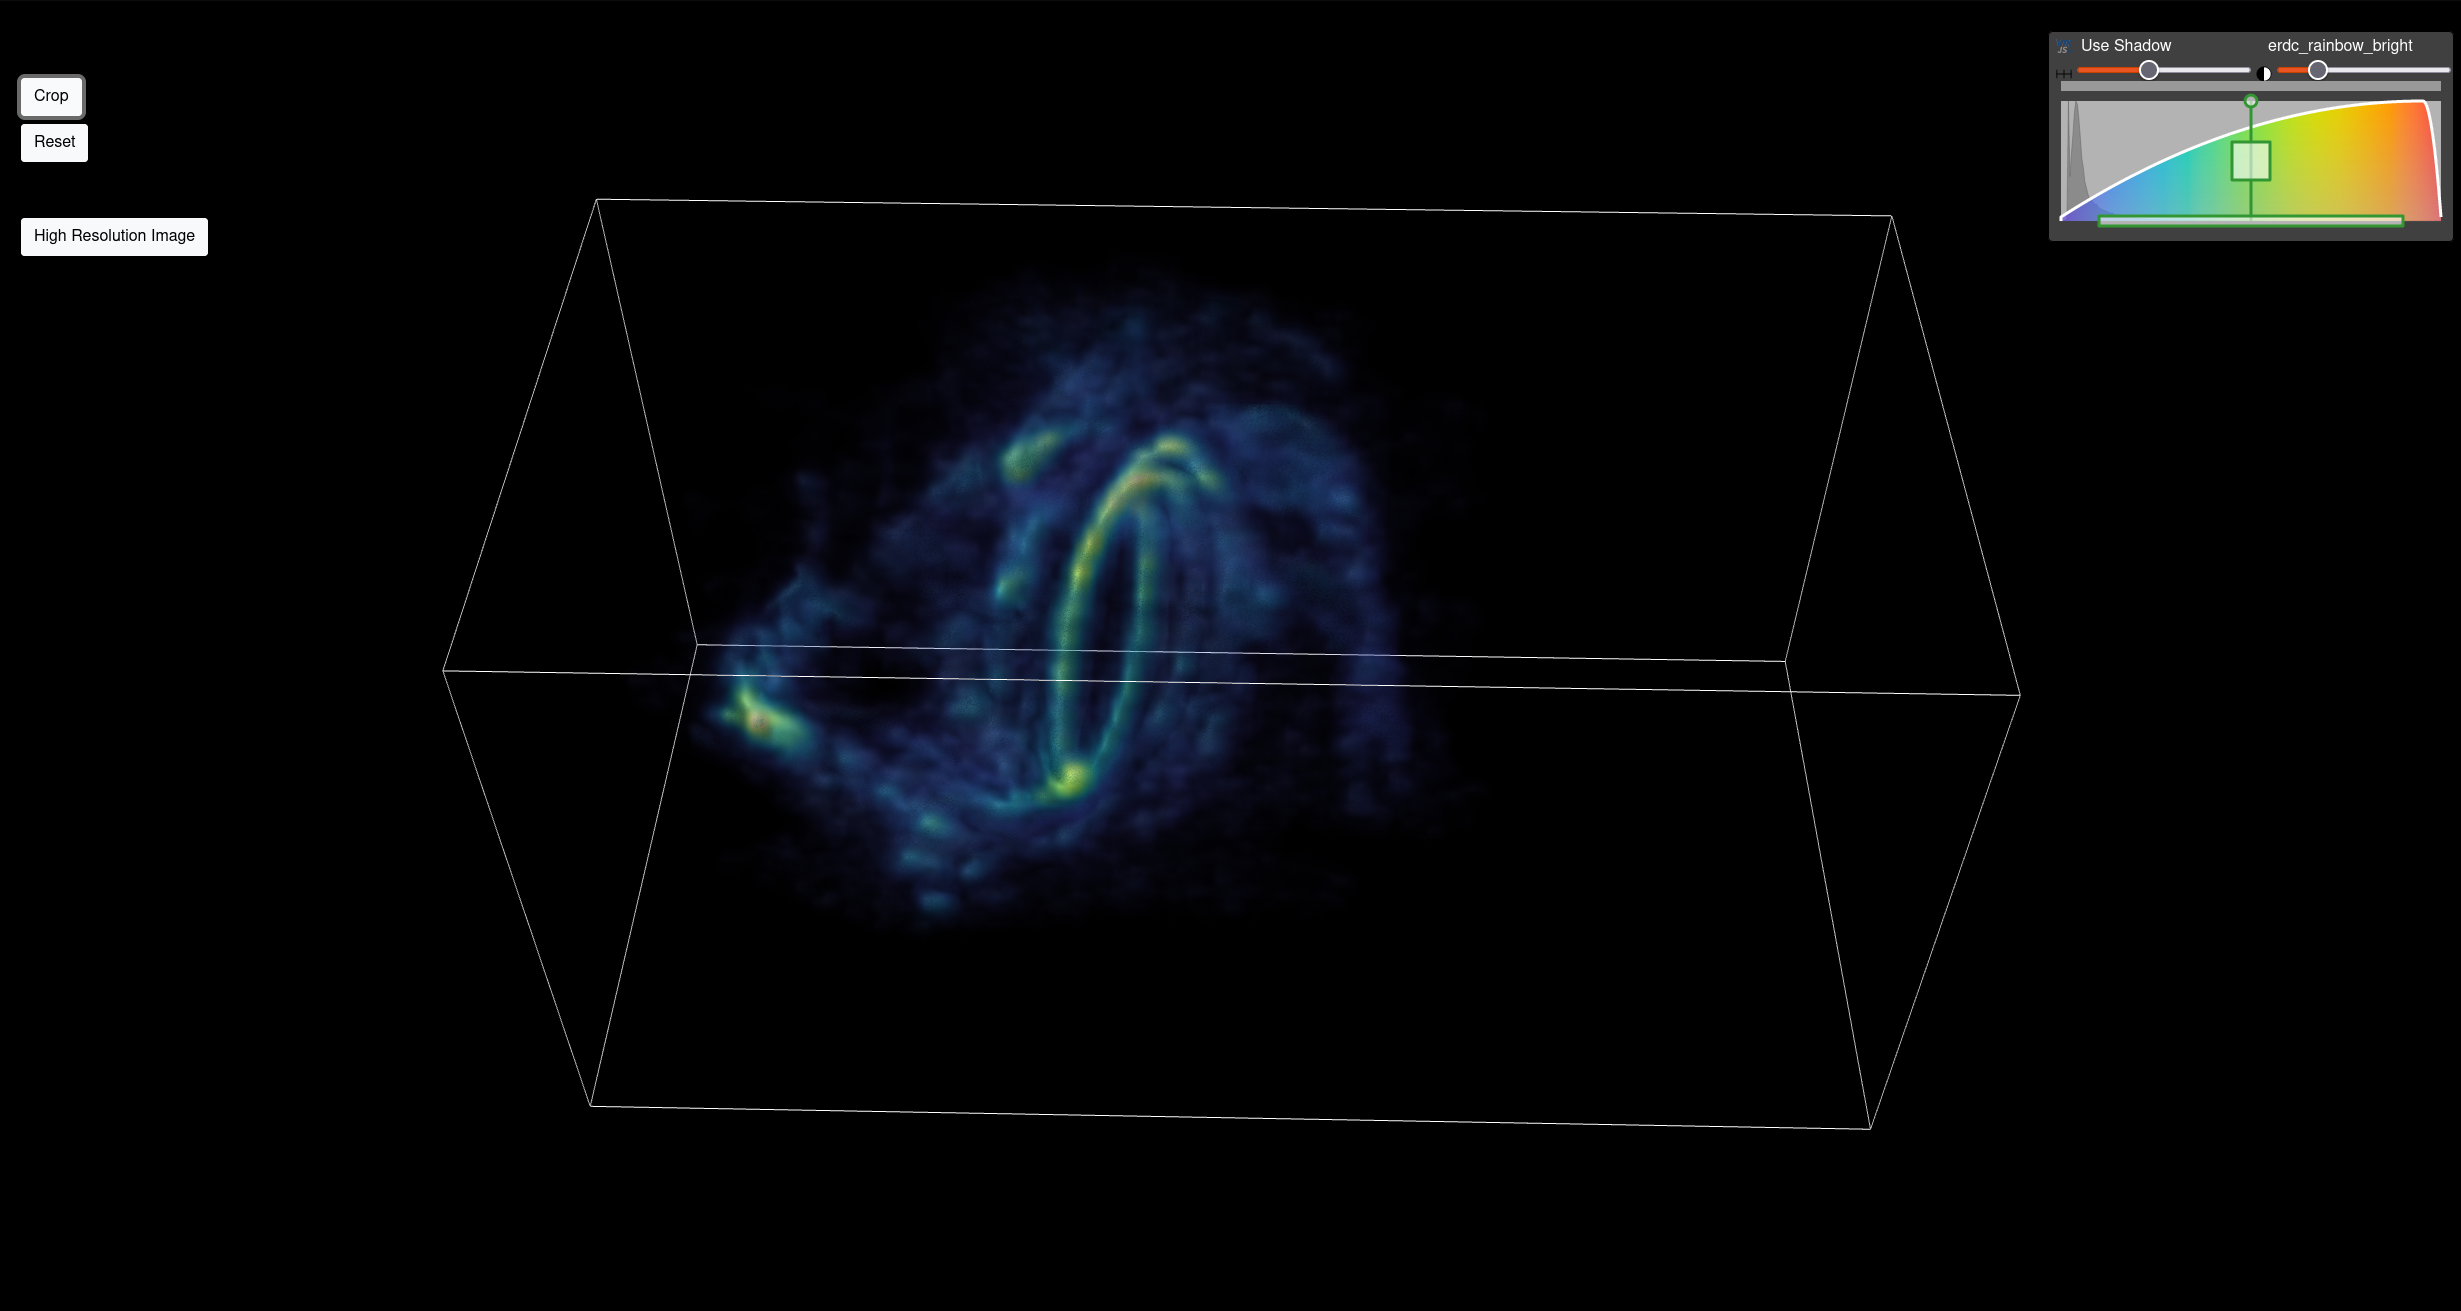
The user Interface of the client system allows the user it access the functionality and interact with the data located within the server. It consists out of elements that allow the user to access the data on the server in the form of files and data cubes, as well as the high resolution visualisations produced by the server. Mechanisms to manipulate the rendering produced by the client such as changing the colour function so that the volume rendering displays differently or to manipulate it position relative to the camera.

Results
Rendering
The rendering time for data cubes on the client system increases linearly with the amount of data points, where as the data cube dimensions increase so does the time required to render it. This is due to no being able to discard any region of the data while rendering, each data cube must be processed and rendered and therefore the execution time for the rendering of the data will have an O(n) relationship with the rendering time. The largest size the data cube can handle is determined by the individual client computer's specifications however limiting the current dimensions of the data cubes to 64 by 64 by 64 ensures the client computer will be able to render data cubes in a timely manner by minimising computational overhead for the client system. A data cube with the dimensions of 64 render on average under half a second while maintaining a high enough resolution to depict significant structures within the volume data. Whereas data cubes with dimensions of 128 will have a higher resolution of the data and depict the structures with more accuracy the number of data points increased exponentially causing the rendering on a single 128 by 128 by 128 to be 1.6 seconds on average, three times the duration of the 64 by 64 by 64 cube. This time could be decreased with more computational resources but it cannot be assumed the the user would have access to such resources. A 32 by 32 by 32 data cube would take less time to render however it will not have high enough resolution to represent the structures within the data. A data cube with 64 by 64 by 64 dimensions requires on average half a second to render, however, the time for combining the cubes if there is more than one must be considered and added to the rendering in order to determine how long the user must wait before interaction can begin.
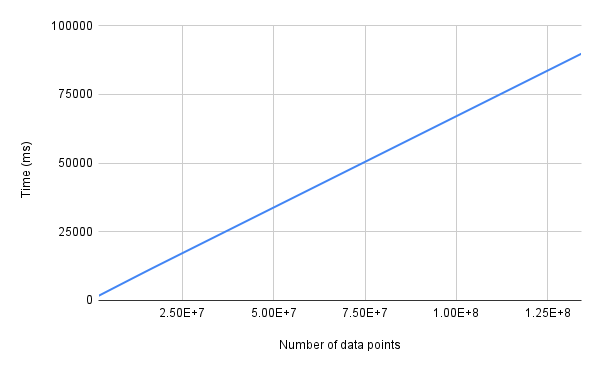
| Number of data point | Cube dimensions | Average Time (ms) | Average time (s) |
|---|---|---|---|
| 262144 | 64x64x64 | 468 | 0.468 |
| 2097152 | 128x128x128 | 1672 | 1.672 |
| 16777216 | 256x256x256 | 11698 | 11.6976 |
| 134217728 | 512x512x512 | 89762 | 89.7618 |
Data cube combination - Cube Size
When combining data cubes of increasing sizes the time required to combine data cubes increases linearly with increased number od data points within the cube. It has the same effect of the time as rendering the larger data cubes where the time increases in a linear relationship with the number of data points.
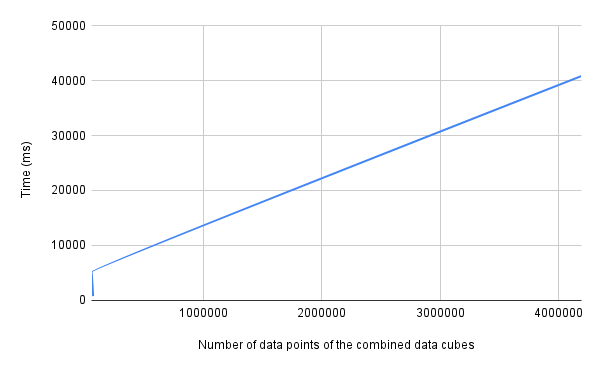
| Number of cubes | Dimensions of cubes | Average Time (ms) | Average time (s) |
|---|---|---|---|
| 2 | 32x32x32 | 780.7 | 0.7807 |
| 2 | 64x64x64 | 5175.7 | 5.1757 |
| 2 | 128x128x128 | 40813.4 | 40.8134 |
Data cube combination - Number of Cubes
When combining multiple data cubes of the same size the time each additional cube adds plots the beginning of an exponential relationship. This is an undesirable result considering the goal of minimising the waiting time for the user. Therefore, within the implementation the total number of cubes the algorithm will have to combine on the client is two. Combing two cubes of 64 by 64 by 64 dimensions requires on average 5 seconds and adding the rendering time it would produce a visualisation of the data within 6 seconds upon receiving the final data cube. This waiting time will only effect the user when initially loading the data and when cropping the cube where cubes are transfer from the server to the client.
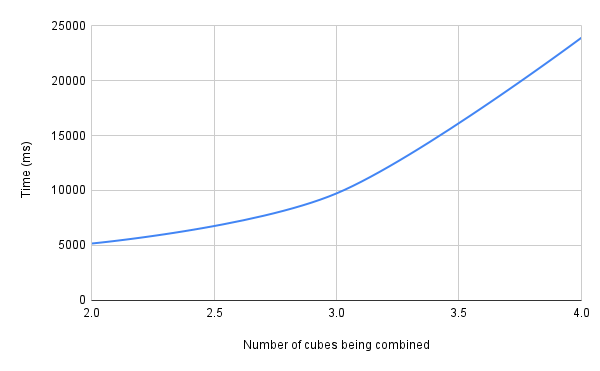
| Number of cubes | Dimensions of cubes | Average Time (ms) | Average time (s) |
|---|---|---|---|
| 2 | 64x64x64 | 5175.7 | 5.1757 |
| 3 | 64x64x64 | 9733.9 | 9.7339 |
| 4 | 64x64x64 | 23895.2 | 23.8952 |